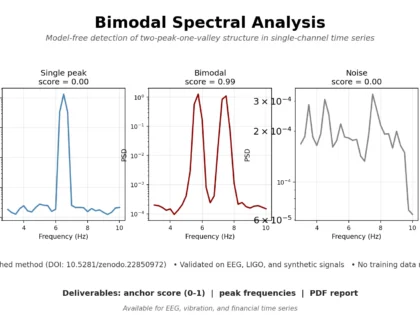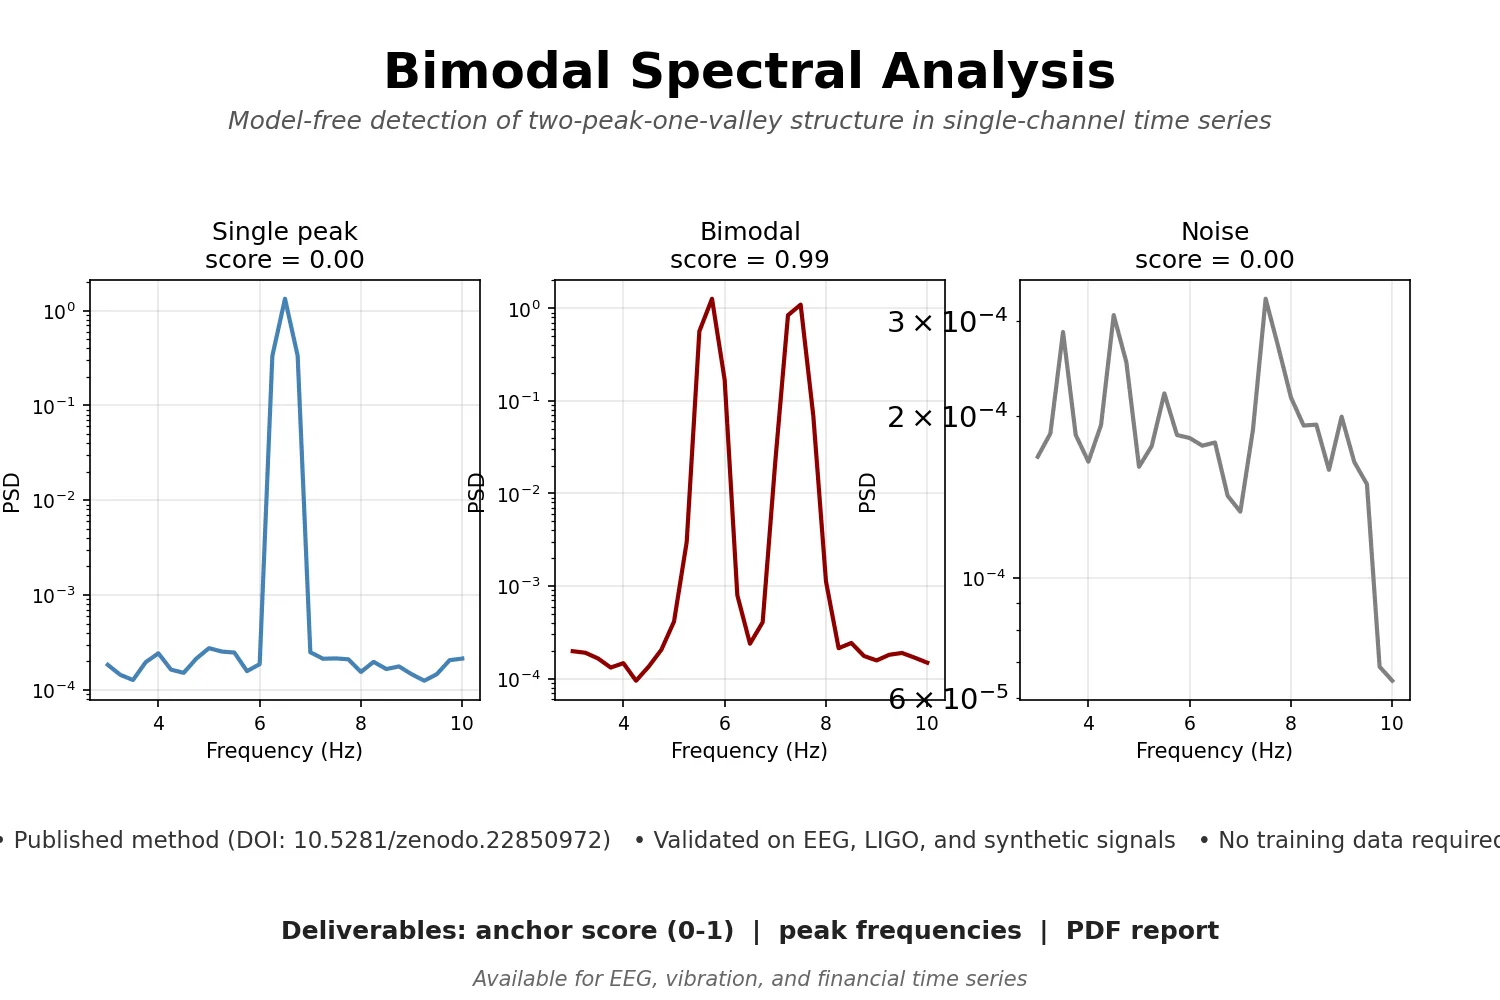
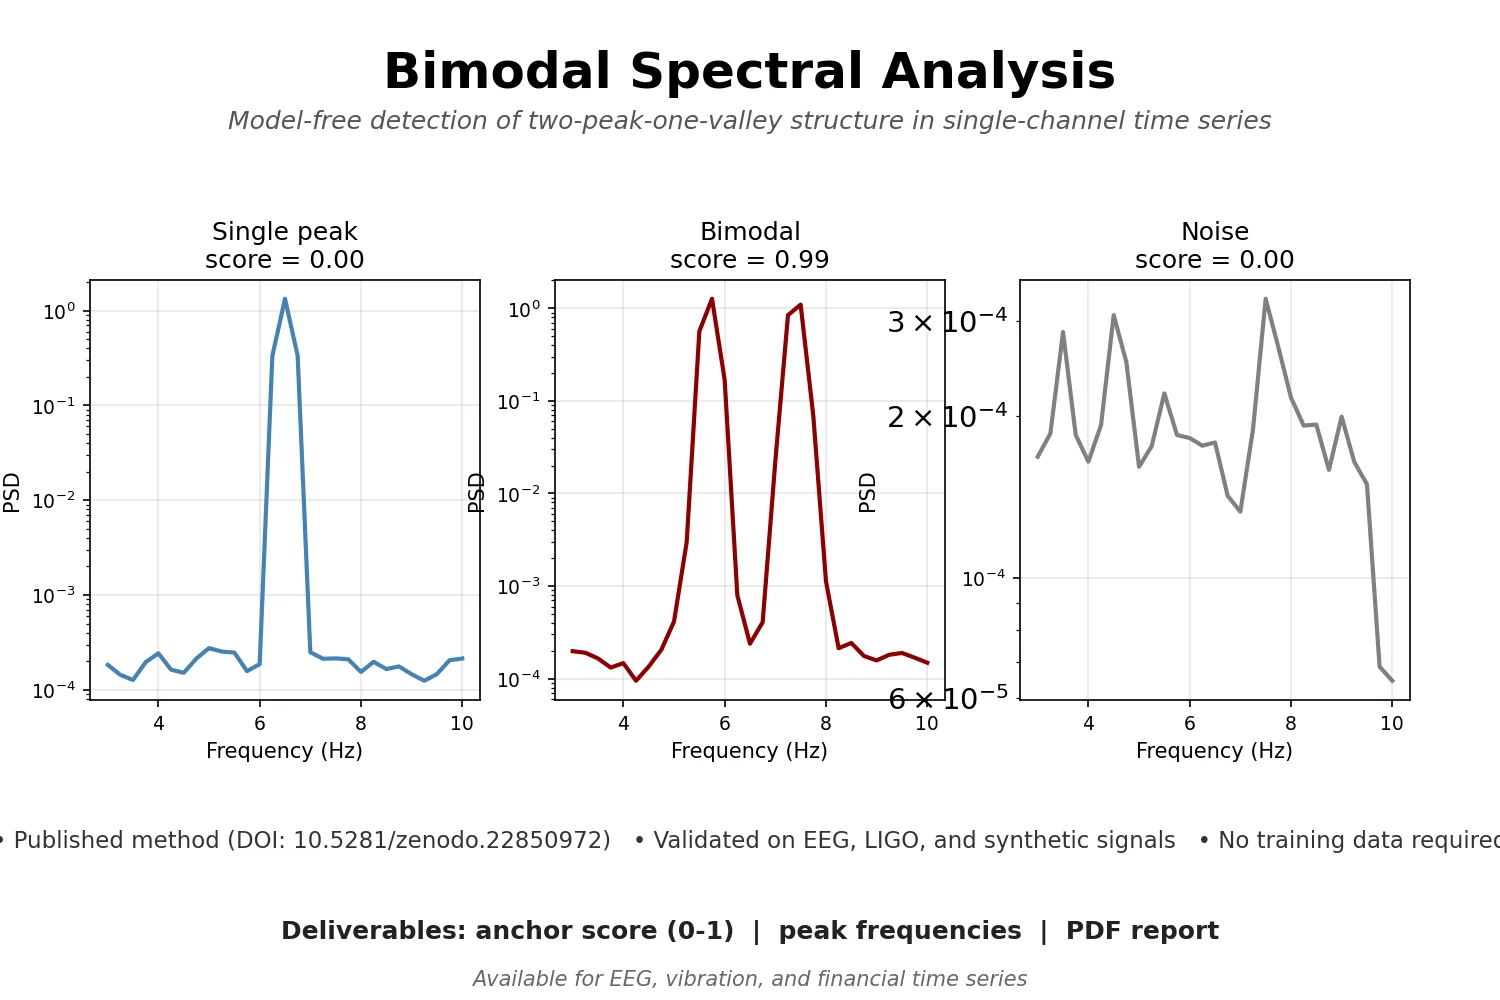
I will perform model-free bimodal spectral analysis on your single-channel time series and return an interpretable anchor score with peak frequencies.

I Will Perform Bimodal Spectral Analysis on Your Time Series and Deliver an Anchor Score Report
Single-file analysis: anchor score, peak frequencies, PDF report.
- 1 single-channel time series file analyzed
- Anchor score (0-1)
- Peak frequencies (f1, f2)
- PDF analysis report
- 1 round of follow-up questions
Batch analysis of up to 10 files with comparison report.
- Up to 10 files analyzed
- Anchor score (0-1) per file
- Peak frequencies (f1, f2) per file
- Cross-file comparison table
- PDF report with summary statistics
- 2 rounds of follow-up questions
Custom analysis for 30+ files, API integration, or long-term monitoring.
- 30+ files or continuous time series
- Anchor score (0-1) per file or per window
- Custom frequency band configuration
- Batch comparison and trend detection
- Custom output formats (JSON, CSV, Excel)
- Delivery in JSON / CSV / PDF
- 3 rounds of follow-up questions
- Optional monthly monitoring subscription
Request a Custom Offer
Log In to Request a Custom Offer
Create a free account or log in to request a personalised offer from this Zinner.
Log In / RegisterAsk a Pre-Sale Question
Log In to Ask a Question
To reduce platform spam, pre-sale messages can only be sent by logged-in users.
Create a free account or log in to message this Zinner directly.
Log In / RegisterAt a Glance
Key details about this service to help you decide. Generated by Zinn Hub, not the seller.
Value Position
Analysis Method
Output Format
Validated Performance
Best For
What You'll Receive
Full Description
## Bimodal Spectral Analysis for Single-Channel Time Series
I provide a model-free analysis service that detects **bimodal spectral structure** — two frequency peaks separated by a valley — in single-channel time series. The method is based on a published preprint (DOI: 10.5281/zenodo.22850972).
Most standard methods (power spectral density, coefficient of variation, sample entropy, coherence) only measure total power, stability, or coupling. They do NOT detect whether a signal contains two distinct oscillatory modes separated by a valley. This service fills that gap.
### What you get
- **Anchor score** (0–1): a single number indicating how strongly bimodal structure is present
- **Peak frequencies** (f1, f2) in Hz
- **Full analysis report** (PDF)
- Optional: batch analysis for multiple channels or multiple files
### What we do NOT provide
- Algorithm source code
- Exact parameter values
- Tuning methods or implementation details
The core algorithm and its parameter settings are retained as a commercial asset. Only the analysis results are delivered.
### Validated performance
- **Synthetic signals**: correctly separates single-peak, bimodal, and noise
- **LIGO O1/O4c1 detector data**: no false positives on broadband noise
- **24-subject meditation EEG dataset** (OpenNeuro ds001787):
- Expert vs novice group difference: p = 0.034
- Five conventional methods (theta power, CV, sample entropy, coherence, naive peak counting) were **not** significant (all p > 0.2)
- Cross-validation across parameters, frequency bands, window lengths, and channel subsets confirmed stability
### Input requirements
- Single-channel time series in CSV format (one column of values)
- Sampling rate (Hz)
- Frequency band of interest (e.g., 3–8 Hz, 50–80 Hz, etc.)
### Delivery time
- Single analysis: within 24 hours
- Batch analysis (10+ files): 3–5 business days
### Potential applications
- **EEG / neuroscience**: meditation research, sleep staging, anesthesia monitoring, neurological disorder detection
- **Mechanical engineering**: vibration monitoring, fault detection, rotating machinery
- **Finance / economics**: regime shift detection, cyclical component analysis
- **Any single-channel time series** where two frequency components carry information
### Pricing
- Single analysis (1 file): $80 USD
- Batch analysis (10+ files): from $600 USD
- Long-term collaboration / API integration: contact for quote
### Contact
ORCID: 0009-0008-4540-1381
[Your email or preferred contact method]
### Disclaimer
This service provides data analysis results only. It does not constitute medical diagnosis, financial advice, or investment recommendation. Results are for research and informational purposes.
Zinner Quality Guarantee
Every Zinner is reviewed and approved before joining the platform.
All services are backed by our quality assurance commitment.
Your payment is protected until you approve the delivered work.
Compare Packages
| 特色 | Basic | Pro | Enterprise |
|---|---|---|---|
| Delivery Time | 3 days | 5 days | 10 days |
| Revisions | 1 | 2 | 3 |
| 1 single-channel time series file analyzed | ✓ | ✕ | ✕ |
| Anchor score (0-1) | ✓ | ✕ | ✕ |
| Peak frequencies (f1, f2) | ✓ | ✕ | ✕ |
| PDF analysis report | ✓ | ✕ | ✕ |
| 1 round of follow-up questions | ✓ | ✕ | ✕ |
| Up to 10 files analyzed | ✕ | ✓ | ✕ |
| Anchor score (0-1) per file | ✕ | ✓ | ✕ |
| Peak frequencies (f1, f2) per file | ✕ | ✓ | ✕ |
| Cross-file comparison table | ✕ | ✓ | ✕ |
| PDF report with summary statistics | ✕ | ✓ | ✕ |
| 2 rounds of follow-up questions | ✕ | ✓ | ✕ |
| 30+ files or continuous time series | ✕ | ✕ | ✓ |
| Anchor score (0-1) per file or per window | ✕ | ✕ | ✓ |
| Custom frequency band configuration | ✕ | ✕ | ✓ |
| Batch comparison and trend detection | ✕ | ✕ | ✓ |
| API integration support (client-side only) | ✕ | ✕ | ✓ |
| Delivery in JSON / CSV / PDF | ✕ | ✕ | ✓ |
| 3 rounds of follow-up questions | ✕ | ✕ | ✓ |
| Optional monthly monitoring subscription | ✕ | ✕ | ✓ |
Extra Information
How it works
Service Details
Frequently Asked Questions
No. The analysis is provided as a service. The algorithm and its parameter settings are retained as a commercial asset. You will receive analysis results, not source code.
A single-column CSV file with numeric values. Please specify the sampling rate in Hz and the frequency band of interest. If your data is in another format (Excel, txt, bdf), message me before ordering.
Single-file analysis: within 3 days. Batch analysis (10+ files): 3-5 business days. Enterprise (30+ files or continuous data): up to 10 days. Express delivery is available as an add-on.
Standard methods (power spectral density, coefficient of variation, sample entropy, coherence) measure total power, stability, or coupling. They do not detect whether a signal contains two frequency peaks separated by a valley. This metric specifically quantifies that structure, outputting a 0-1 anchor score. It is orthogonal to conventional methods and can be used alongside them.
Refunds are available if the analysis cannot be completed due to data format issues. Once the report is delivered, refunds are not available. If you are unsure whether your data is suitable, message me before ordering.
Yes. You may use the analysis results in academic publications. Please cite the underlying method: Ou, Q. (2026). Detecting Bimodal Spectral Structure in Single-Channel Time Series. Zenodo. DOI: 10.5281/zenodo.22850972.
Customer Reviews
See what our customers say about this Zinn
Categories
Zinner Policies
Related Zinns