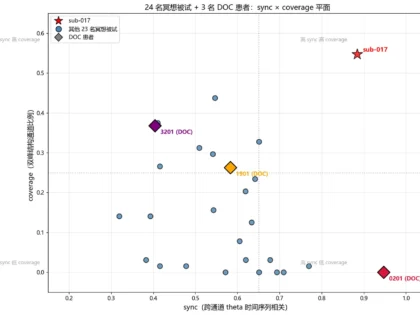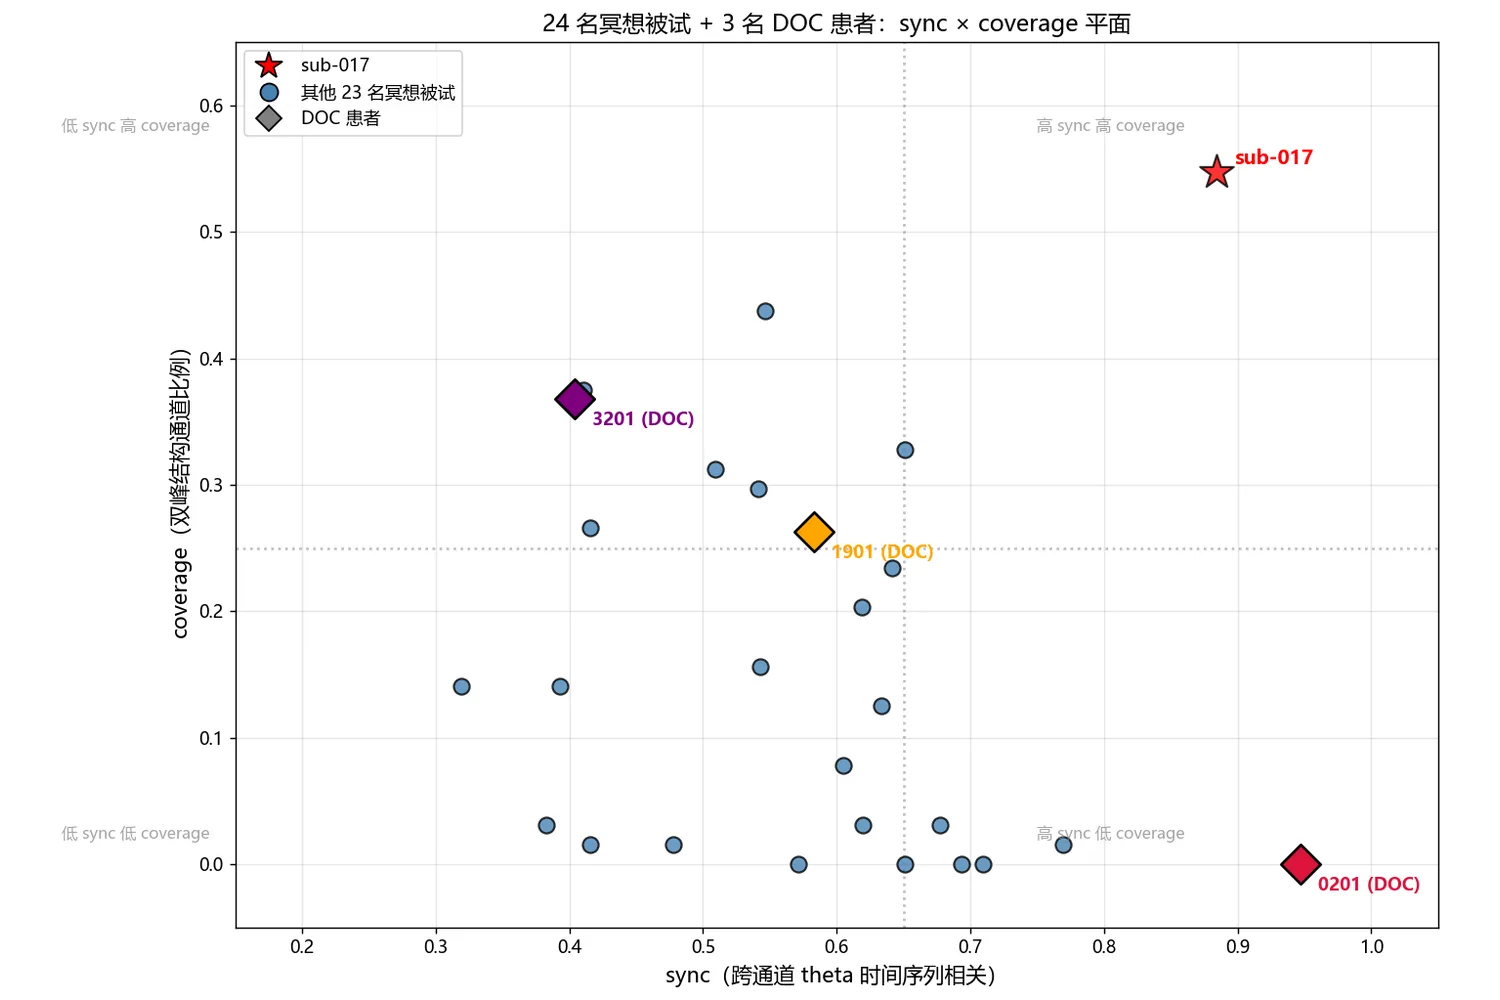
Separate functional from pathological brain synchrony in your EEG data. I map your recording onto the sync × coverage plane — a new framework published on Zenodo (DOI: 10.5281/zenodo.23103048). For consciousness, meditation, DOC, and anesthesia research.

I Will Classify EEG Brain States With a Published Two-Dimensional Synchrony Framework
One EEG recording → a scatter plot on the sync × coverage plane + a 1-page written interpretation.
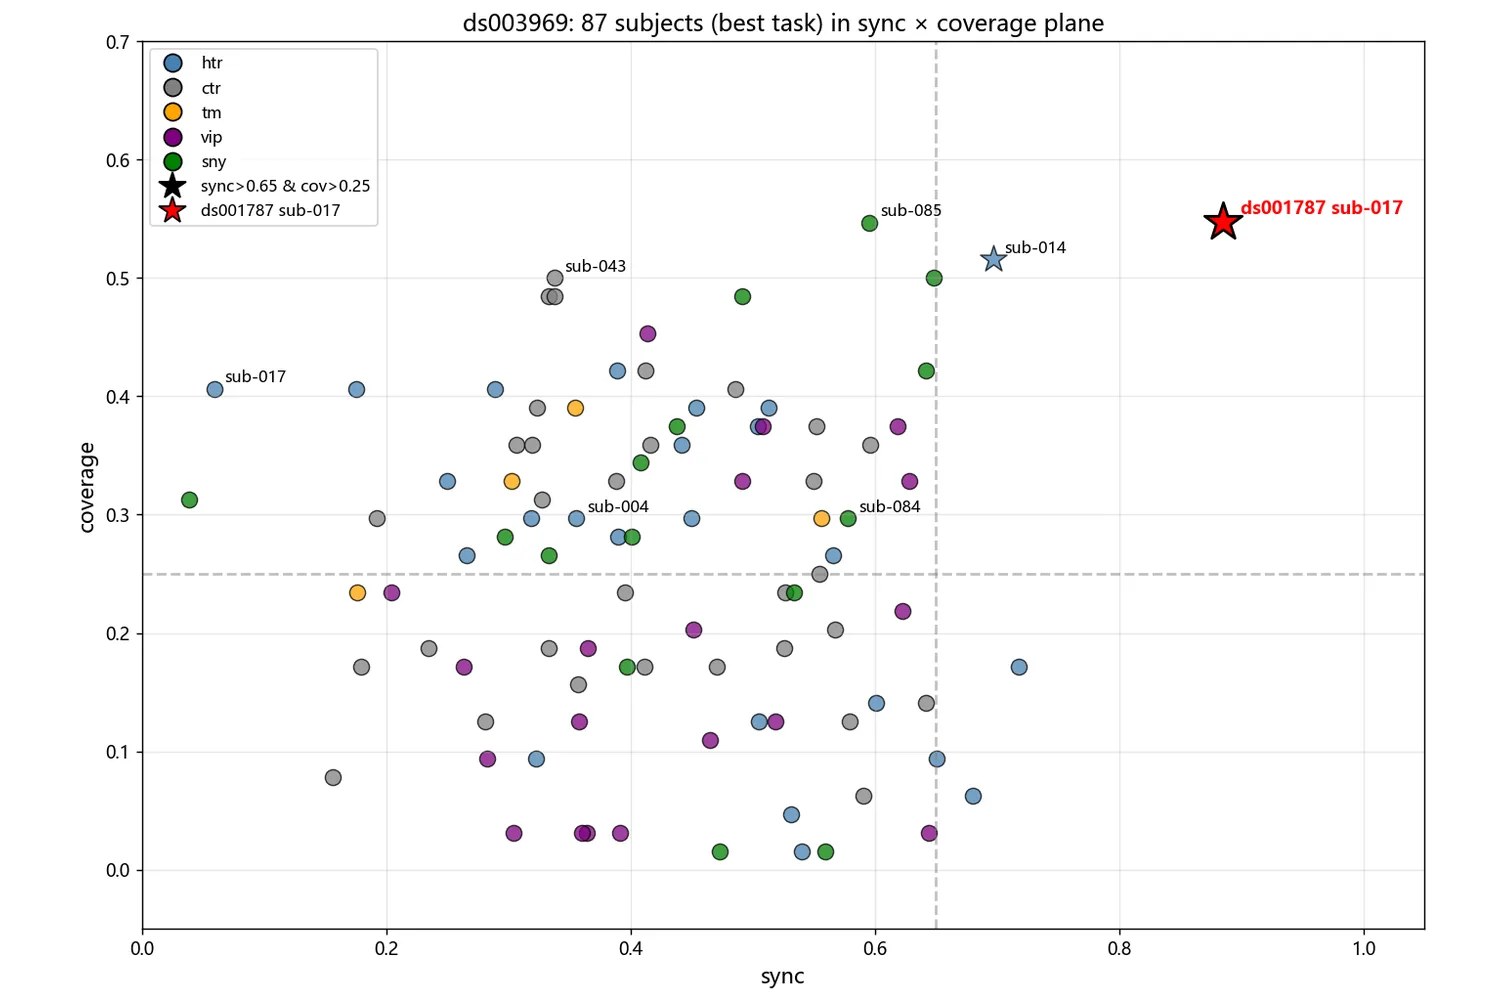
- Scatter plot of your recording on the sync × coverage plane
- Reference clouds from 111 published subjects as background
- One-page written interpretation (PDF)
- All figures as PNG files
- Scatter plot coordinates (CSV) — per-subject sync and coverage values
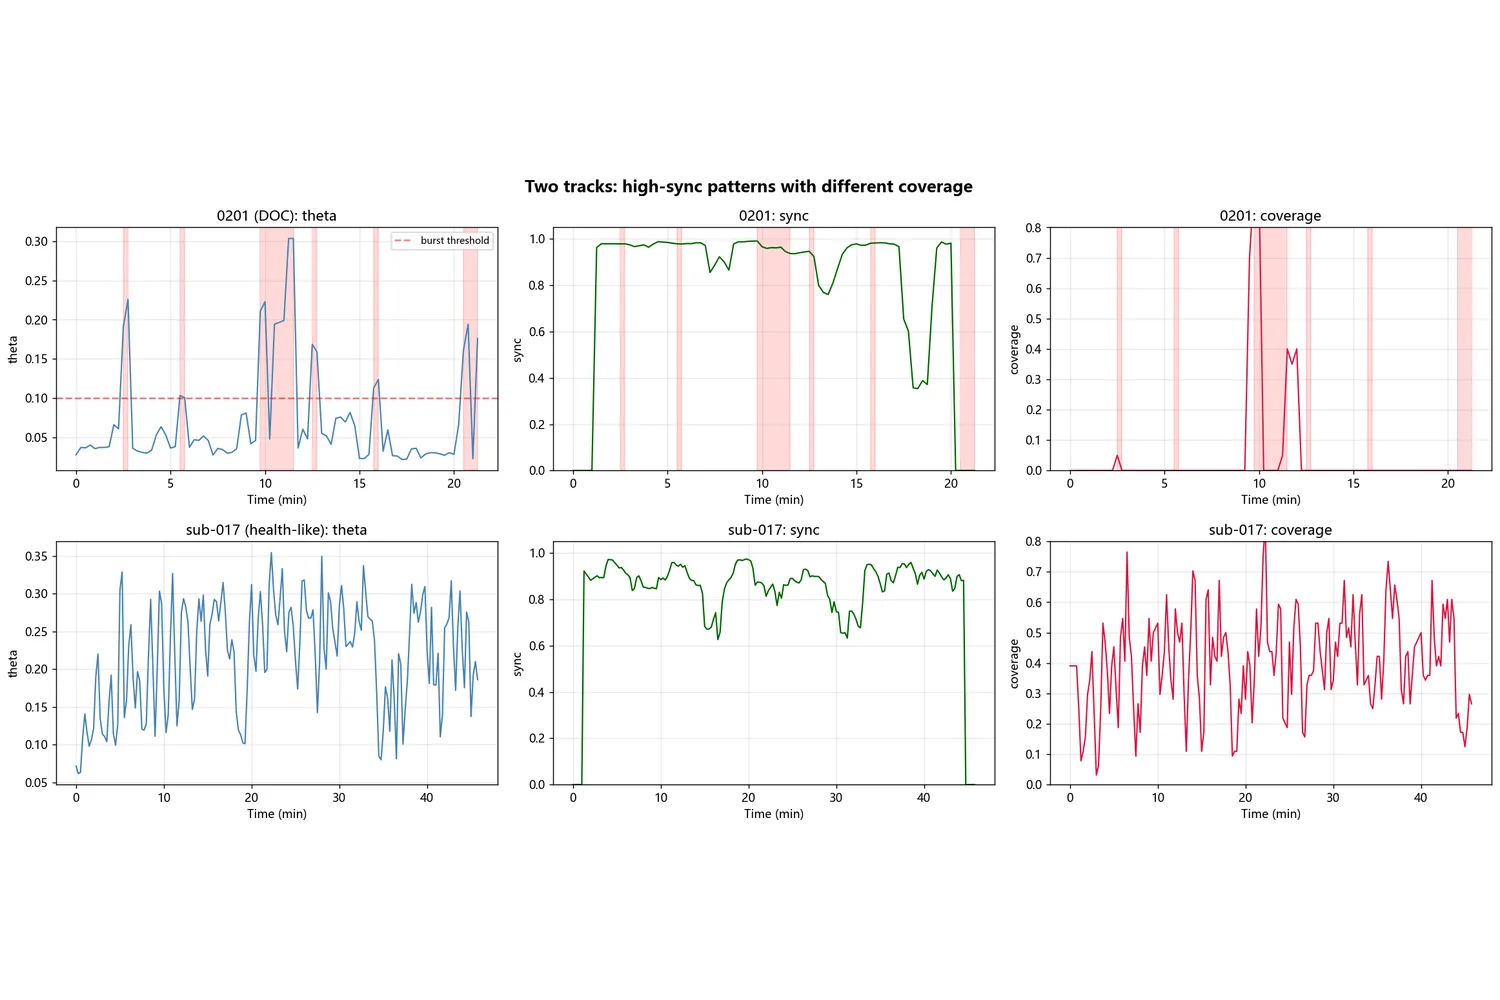
One EEG recording → four figures (sync, coverage, theta time course) + a full 2-page report.
- Everything in Basic
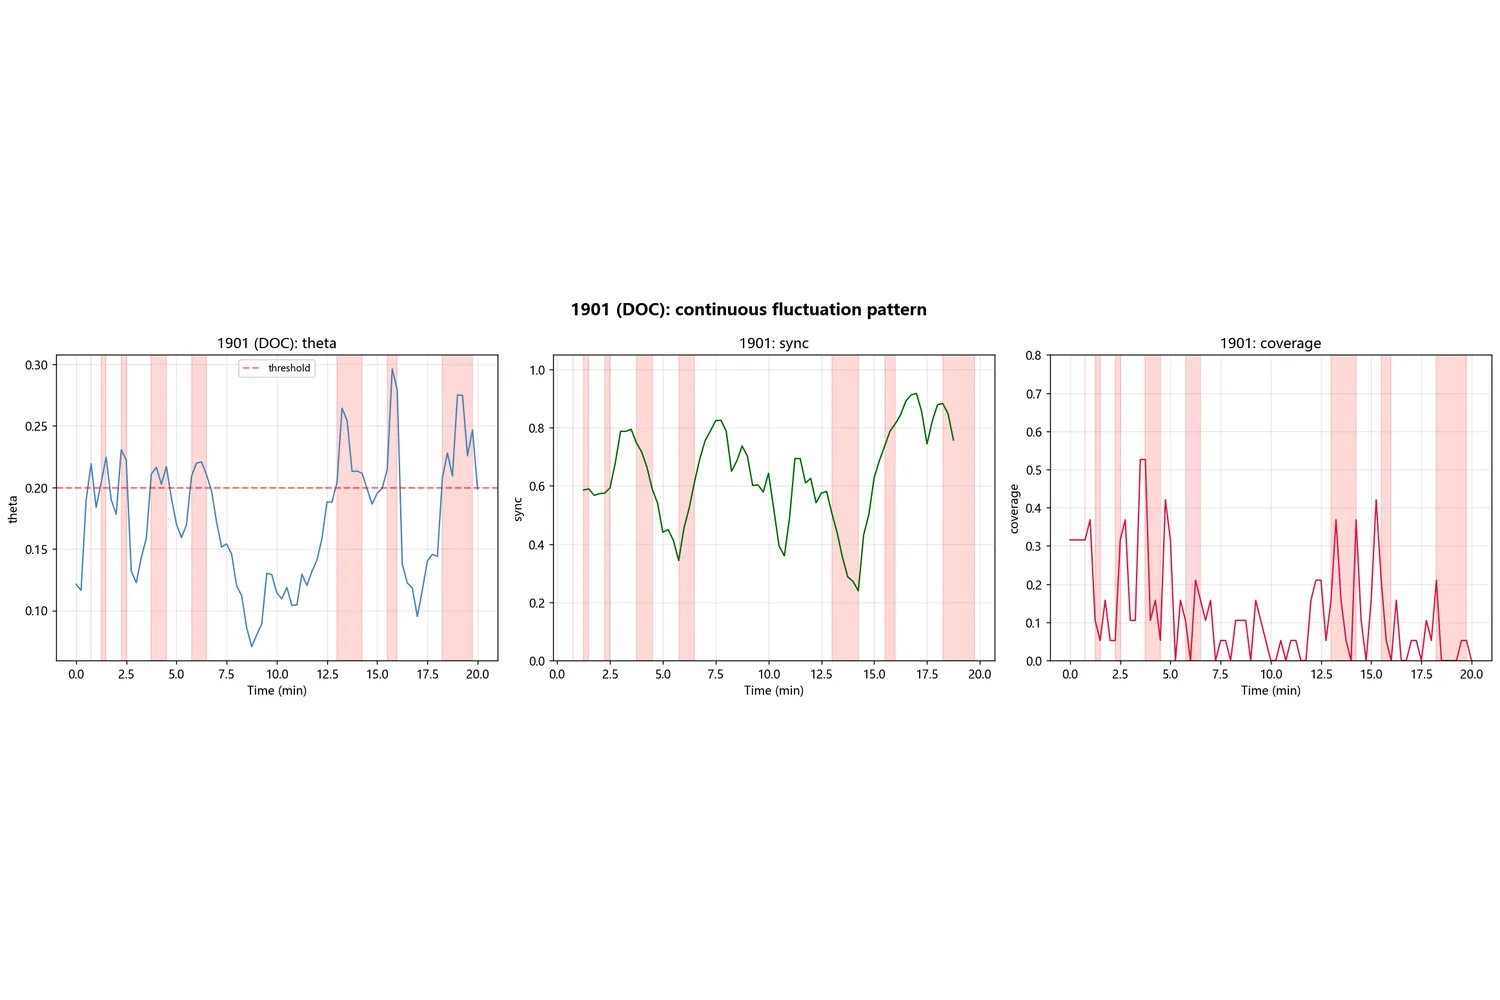
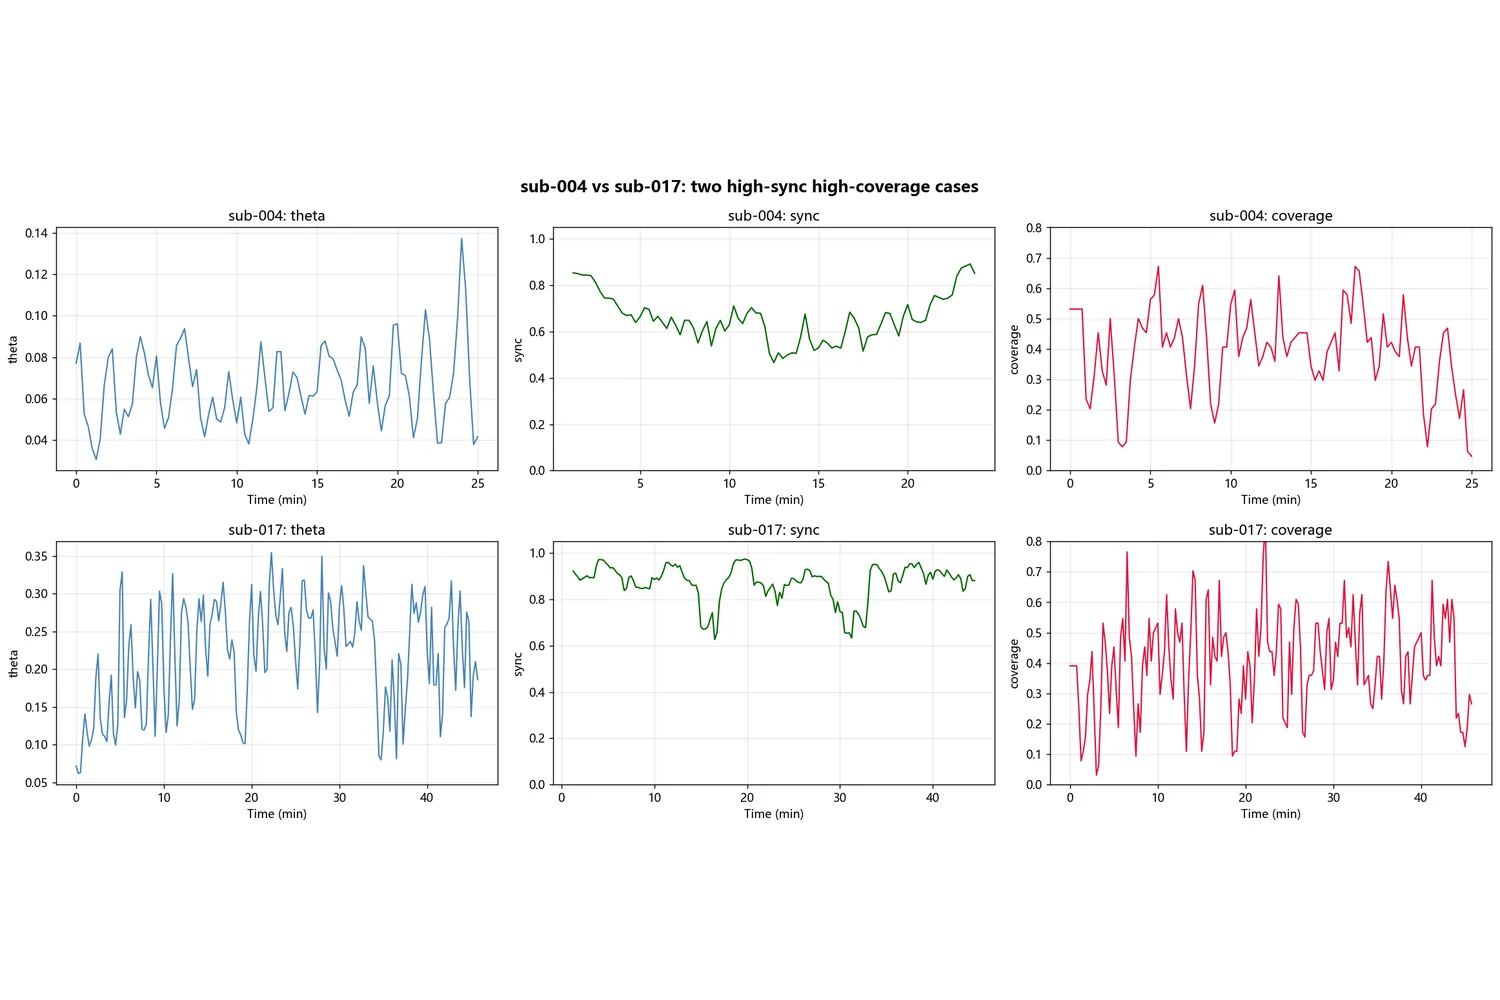
- Time-resolved sync curve
- Time-resolved coverage curve
- Time-resolved theta curve
- Full 2-page written report (PDF)
- CSV file with per-subject sync and coverage values
Request a Custom Offer
Log In to Request a Custom Offer
Create a free account or log in to request a personalised offer from this Zinner.
Log In / RegisterAsk a Pre-Sale Question
Log In to Ask a Question
To reduce platform spam, pre-sale messages can only be sent by logged-in users.
Create a free account or log in to message this Zinner directly.
Log In / RegisterAt a Glance
Key details about this service to help you decide. Generated by Zinn Hub, not the seller.
Value Position
Analysis Framework
Data Requirements
Research Applications
Deliverables
What You'll Receive
Full Description
EEG Analysis: Sync × Coverage Plane Mapping
This service maps your EEG recording onto a two-dimensional brain-state plane (sync × coverage) — a framework I published on Zenodo.
Preprint: https://doi.org/10.5281/zenodo.23103048
What makes this different from traditional EEG analysis?
Conventional EEG synchrony metrics (coherence, PLV, wPLI, AEC) only measure how strongly brain regions oscillate together. They cannot distinguish two completely different brain states that yield identical high synchrony values:
Functional whole-brain coordination — meditation, conscious cognitive activity
Pathological high synchrony — epileptic discharges, burst-suppression, disorders of consciousness
This ambiguity creates major interpretation problems in consciousness research, EEG connectivity analysis, and neurodynamic studies.
My sync × coverage framework resolves this by adding a second dimension (coverage) that separates these two categories.
Suitable research fields
Consciousness research and meditation EEG studies
Disorders of consciousness (DOC, vegetative state, minimally conscious state)
Anesthesia-induced brain state transitions
Neurophysiology and brain dynamics
EEG connectivity, coherence, and neural synchrony analysis
EEG time-series and brain oscillation studies
Neuroimaging data analysis in academic research
What you will receive
Scatter plot showing your EEG data position on the sync × coverage plane, with reference background cloud from 111 published subjects (meditation, DOC, anesthesia datasets)
Time-resolved trajectory plot showing how your brain signal moves across the plane over recording time
One-page written interpretation explaining which brain-state pattern your data resembles
All figures delivered as high-resolution PNG files
Data requirements
File format: EDF, BDF or BrainVision
Sampling rate ≥ 100 Hz
Minimum recording duration: 5 minutes
Minimum channels: 16
Turnaround time: 5 business days
If you are unsure whether your dataset meets the requirements, please send me a message before placing the order.
Important Disclaimer
This service is for academic research purposes only. It is not clinical medical diagnosis.
I do not provide source code, raw calculation scripts, or algorithm parameters.
You must hold full legal rights to the uploaded EEG dataset. Raw EEG recordings will not be permanently stored after delivery.
Zinner Quality Guarantee
Every Zinner is reviewed and approved before joining the platform.
All services are backed by our quality assurance commitment.
Your payment is protected until you approve the delivered work.
Compare Packages
| 特色 | Basic | Standard |
|---|---|---|
| Delivery Time | 5 days | 7 days |
| Revisions | 1 | 2 |
| Scatter plot of your recording on the sync × coverage plane | ✓ | ✓ |
| Reference clouds from 111 published subjects as background | ✓ | ✓ |
| One-page written interpretation (PDF) | ✓ | ✓ |
| All figures as PNG files | ✓ | ✓ |
| Time-resolved sync curve | ✕ | ✓ |
| Time-resolved coverage curve | ✕ | ✓ |
| Time-resolved theta curve | ✕ | ✓ |
| Full 2-page written report (PDF) | ✕ | ✓ |
Portfolio
Examples of the seller's work related to this Zinn.

High Synchrony Is Not Whole-Brain Coordination
A Distinctive Theta-Beta Anticorrelation in Meditation EEG
Extra Information
Methodology
Service Details
Frequently Asked Questions
EDF, BDF, and BrainVision (vhdr + eeg + vmrk). If your file is in another format, message me first — I may be able to convert it.
The metrics require at least 5 minutes of continuous data. If your recording is shorter, message me before ordering — I can tell you whether a partial analysis is possible.
No. I delete your file within 7 days after delivery. Your data is never shared, published, or used for any other purpose.
If the analysis is technically incorrect, I will redo it at no cost. If you simply want additional interpretation, that counts as a revision (Basic includes 1, Standard includes 2).
No. This service maps your recording onto a two-axis plane and tells you which published cohort it most resembles. It is a descriptive tool, not a diagnostic one. No claims are made about subjective states.
Yes. I can process up to 4 recordings in a single order (Standard package or above). Each recording is analyzed independently and delivered as a separate report. If you have more than 4, message me first — I can set up a custom package.
Customer Reviews
See what our customers say about this Zinn
Categories
Zinner Policies
Related Zinns