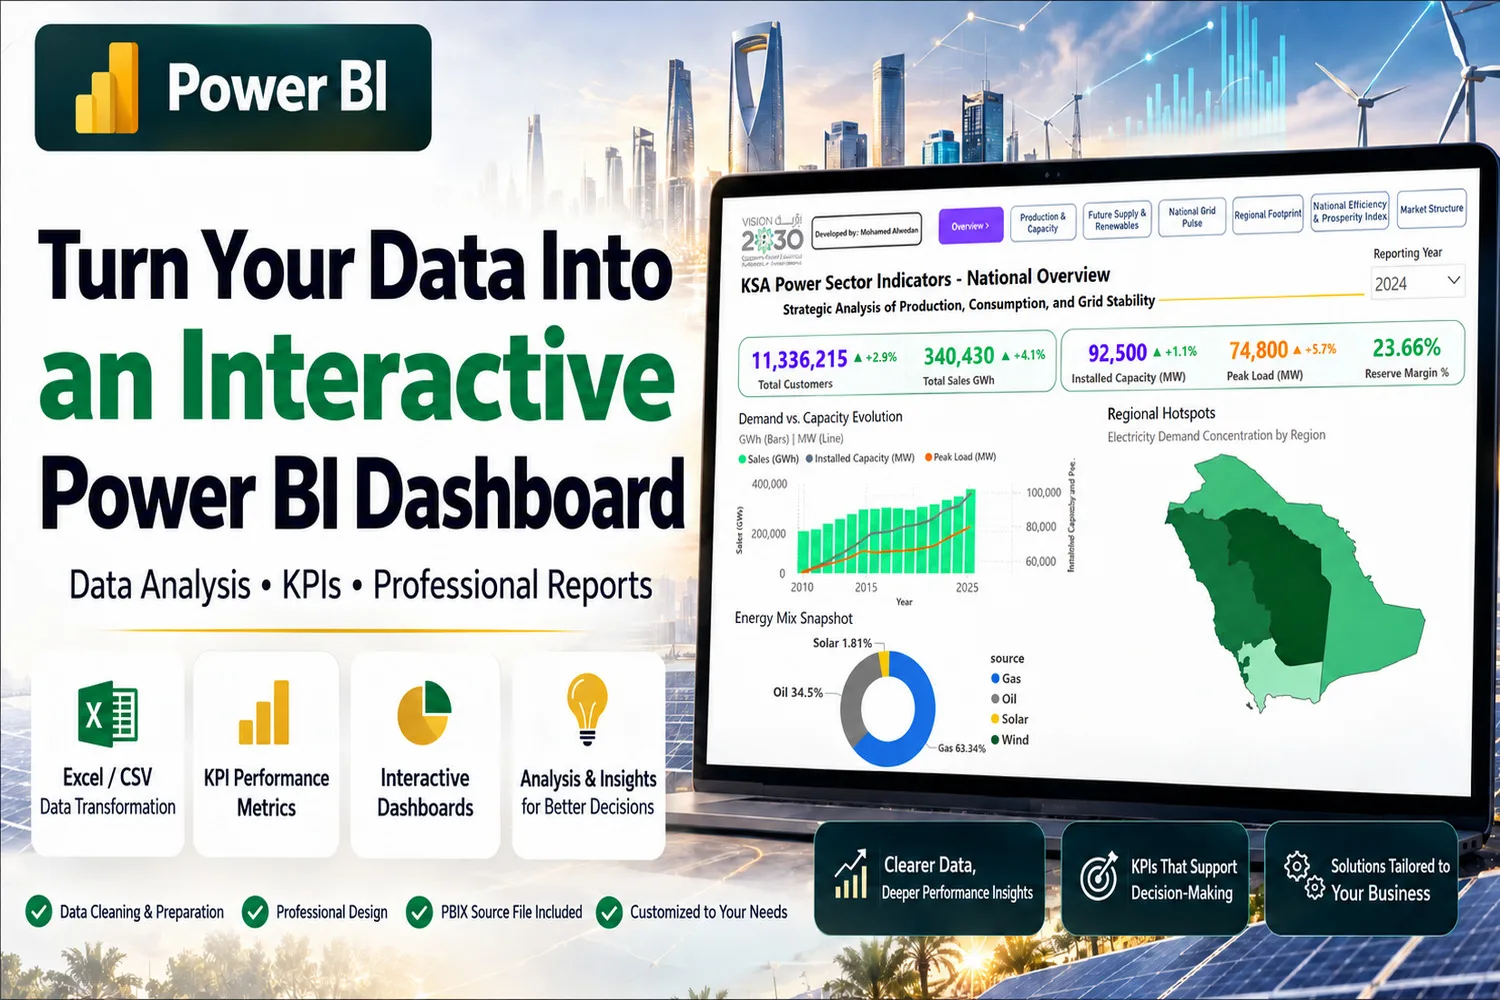
I will turn your raw Excel or CSV data into a clear, interactive Power BI dashboard with meaningful KPIs, professional visuals, and business-focused insights.

I Will build an interactive Power BI dashboard with KPIs and data analysis
A focused Power BI dashboard for a small, well-structured dataset with essential KPIs, interactive visuals, and basic data preparation.
- 1 data source
- 1 dashboard page
- Up to 4 KPIs
- Basic data cleaning and transformation
- Interactive charts and visuals
- Filters and slicers
- Power BI PBIX source file
- 1 revision
A complete Power BI dashboard with data preparation, modelling, DAX measures, KPIs, and interactive reporting for business analysis.
- Up to 3 data sources
- Up to 2 dashboard pages
- Up to 8 KPIs
- Data cleaning and transformation with Power Query
- Structured data model
- DAX measures
- Interactive charts and visuals
- Filters and slicers
- Trend and comparison analysis
- Power BI PBIX source file
- 2 revisions
An advanced multi-page Power BI solution for larger datasets, deeper analysis, complex DAX, and structured business intelligence reporting.
- Up to 5 data sources
- Up to 4 dashboard pages
- Up to 15 KPIs
- Advanced data cleaning and transformation
- Structured data modelling
- Advanced DAX measures
- KPI, trend, and comparison analysis
- Interactive navigation
- Filters and slicers
- Power BI PBIX source file
- Handover notes
- 3 revisions
Request a Custom Offer
Log In to Request a Custom Offer
Create a free account or log in to request a personalised offer from this Zinner.
Log In / RegisterAsk a Pre-Sale Question
Log In to Ask a Question
To reduce platform spam, pre-sale messages can only be sent by logged-in users.
Create a free account or log in to message this Zinner directly.
Log In / RegisterAt a Glance
Key details about this service to help you decide. Generated by Zinn Hub, not the seller.
Value Position
Core Tool
Data Modelling
Data Preparation
Credentials
What You'll Receive
Full Description
Turn your data into a clear, decision-ready Power BI dashboard
If you have business data in Excel, CSV, or another structured format and need a professional way to understand performance, trends, and key metrics, I can build an interactive Power BI dashboard tailored to your goals.
My focus is not only on creating charts. I structure the data, define useful KPIs, build a reliable data model, and design the dashboard so that the final result is clear, practical, and easy to explore.
What I can deliver
Depending on the package and project scope, your dashboard can include:
Data cleaning and transformation using Power Query
Structured data modelling
KPI and performance measure creation
DAX calculations
Interactive charts and visualisations
Filters and slicers
Trend and comparison analysis
Multiple dashboard pages
Business-focused layout and navigation
Clear handover notes
Power BI PBIX source file
My process
1. Understand your goal
I review your data, reporting requirements, KPIs, and the decisions you want the dashboard to support.
2. Prepare the data
I clean, transform, and organise the source data using Power Query where needed.
3. Build the data model
I create a structured model suitable for accurate analysis and scalable reporting.
4. Create KPIs and calculations
I build the required measures using DAX and define the metrics needed for your dashboard.
5. Design the dashboard
I create a clean and interactive report focused on readability, useful comparisons, and practical business insight.
6. Review and handover
I check the final dashboard, apply agreed revisions, and provide the PBIX file together with relevant handover notes.
Why work with me?
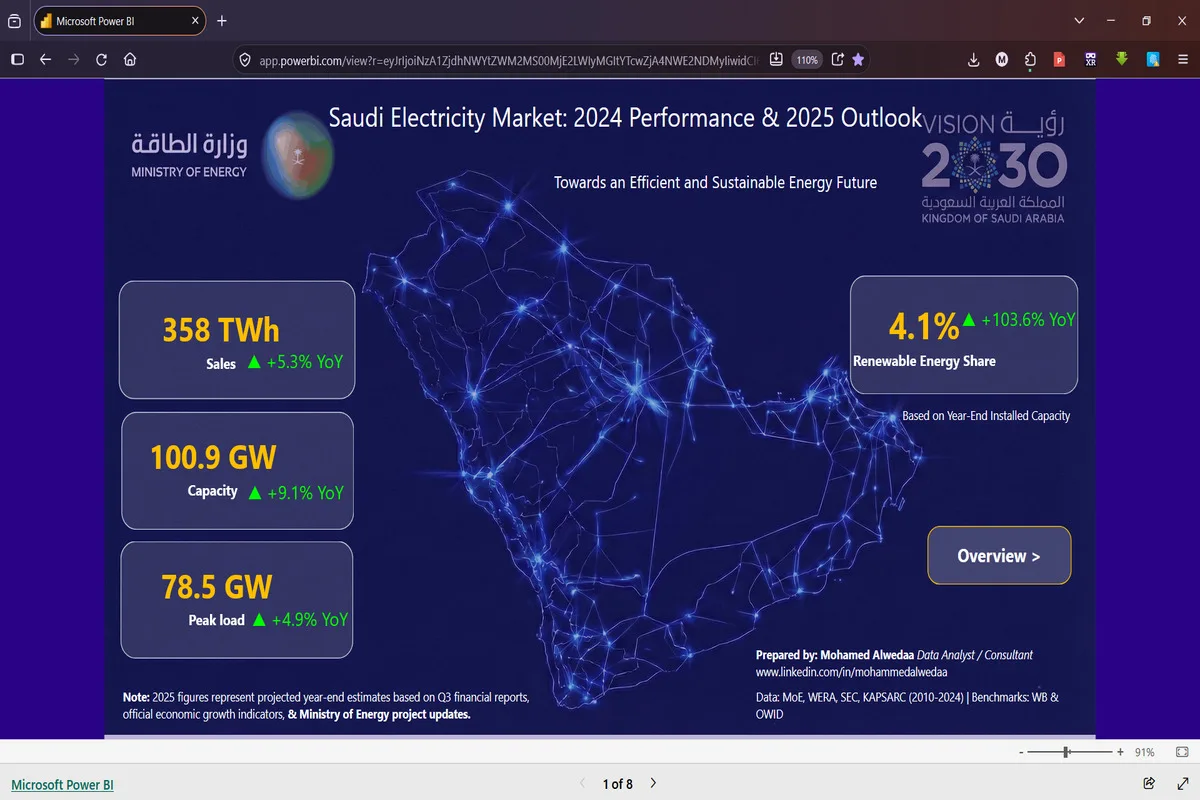
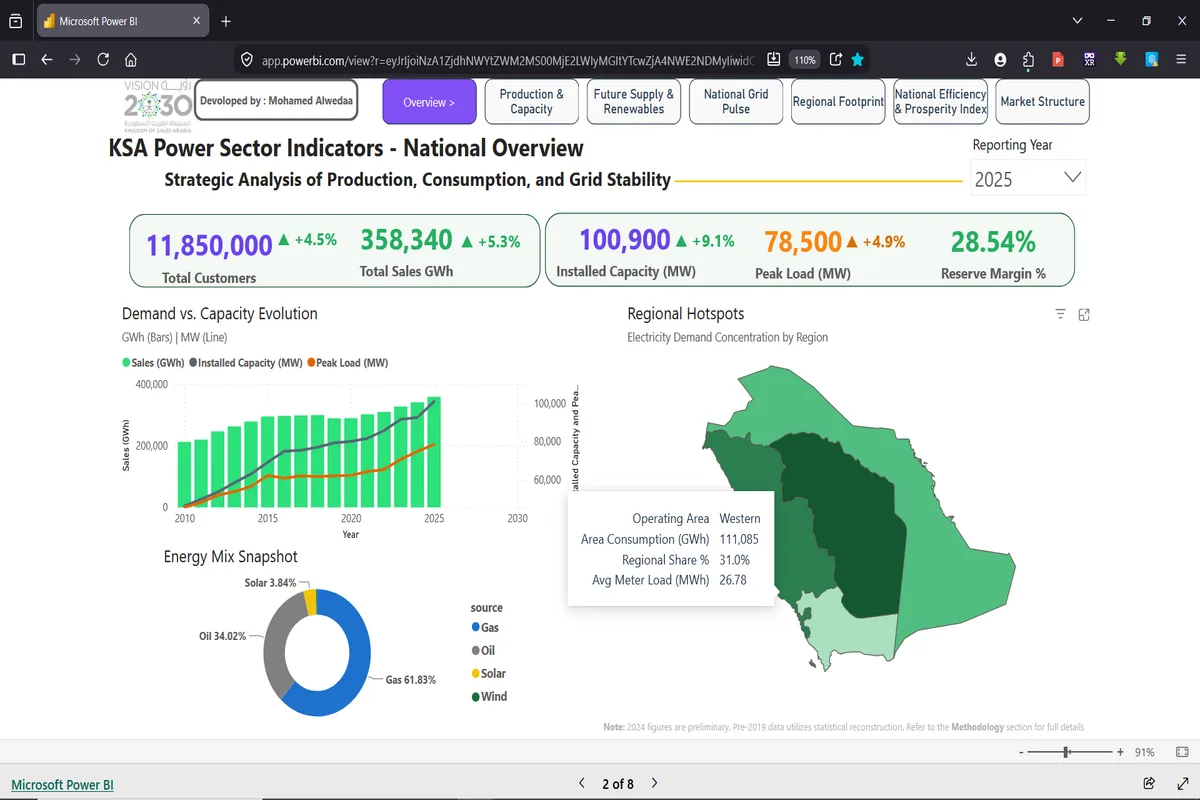
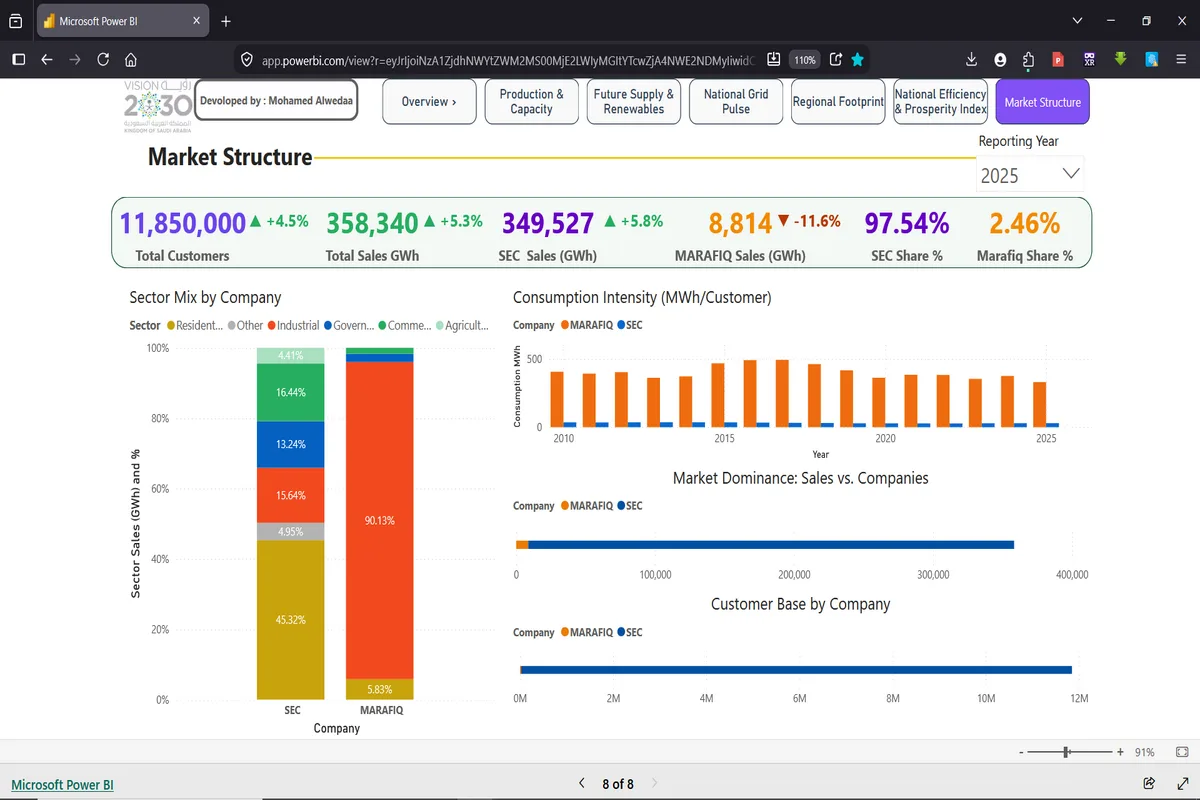
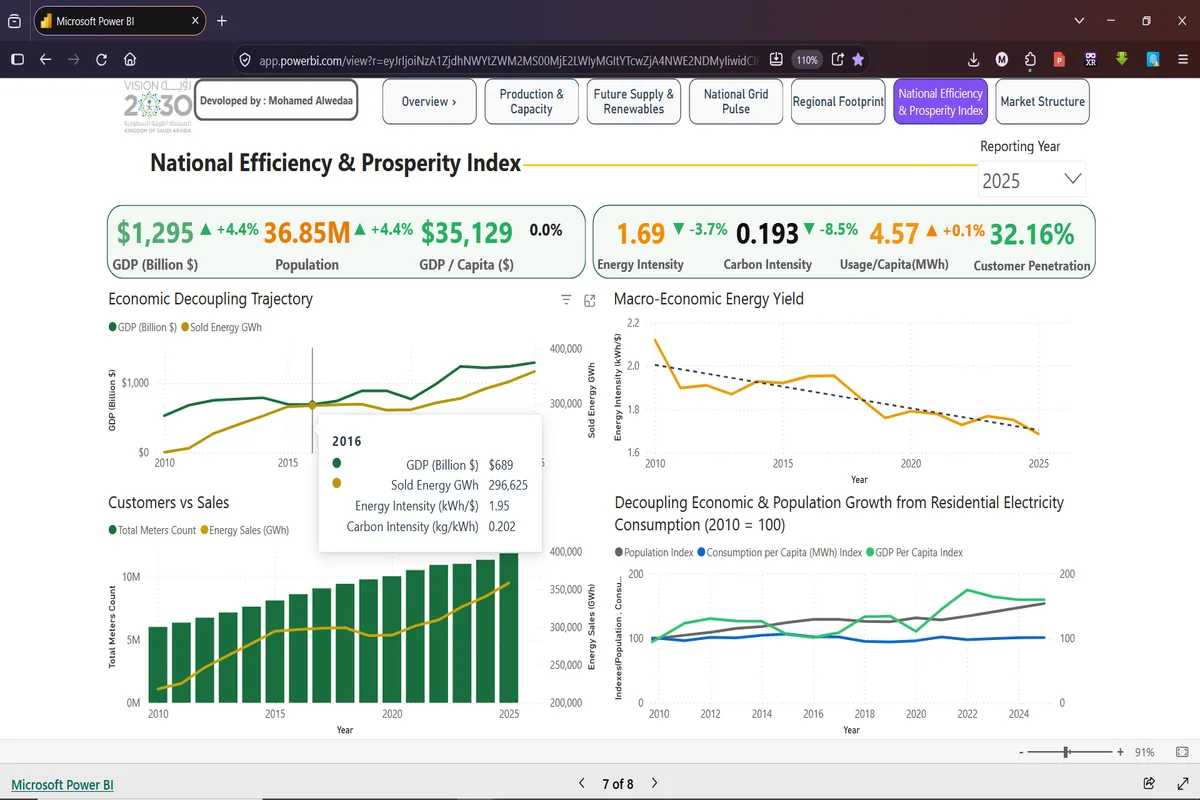
I have practical experience in Power BI, data analysis, SQL, Excel, data modelling, ETL, and business intelligence. My portfolio includes a multi-page strategic Power BI analysis of the Saudi energy market using Power Query, Star Schema modelling, advanced DAX measures, KPI analysis, time intelligence, and interactive reporting.
I also hold the Microsoft Power BI Data Analyst Professional Certificate and the Google Data Analytics Professional Certificate.
Before ordering
Please send a brief description of your goal and a sample of your data if possible. This helps confirm the correct package and ensures that the required KPIs, pages, and transformations are clearly defined before work begins.
Delivery time and scope depend on the selected package, dataset size, data quality, number of dashboard pages, and complexity of the required calculations.
Zinner Quality Guarantee
Every Zinner is reviewed and approved before joining the platform.
All services are backed by our quality assurance commitment.
Your payment is protected until you approve the delivered work.
Compare Packages
| Feature | Basic Dashboard | Business Dashboard | Advanced BI Dashboard |
|---|---|---|---|
| Delivery Time | 3 days | 5 days | 7 days |
| Revisions | 1 | 2 | 3 |
| Data Sources | 1 | Up to 3 | Up to 5 |
| Dashboard Pages | 1 | Up to 2 | Up to 4 |
| KPIs | Up to 4 | Up to 8 | Up to 15 |
| Data Cleaning | Basic | Power Query | Advanced Power Query |
| Interactive visuals | ✓ | ✓ | ✓ |
| Filters and slicers | ✓ | ✓ | ✓ |
| Power BI PBIX source file | ✓ | ✓ | ✓ |
| DAX measures | Basic | ✓ | Advanced |
| Trend and comparison analysis | ✕ | ✓ | ✓ |
| Data Modelling | Basic | Structured | Advanced structured model |
| Interactive navigation | ✕ | ✓ | ✓ |
| Handover notes | ✕ | ✕ | ✓ |
Portfolio
Examples of the seller's work related to this Zinn.
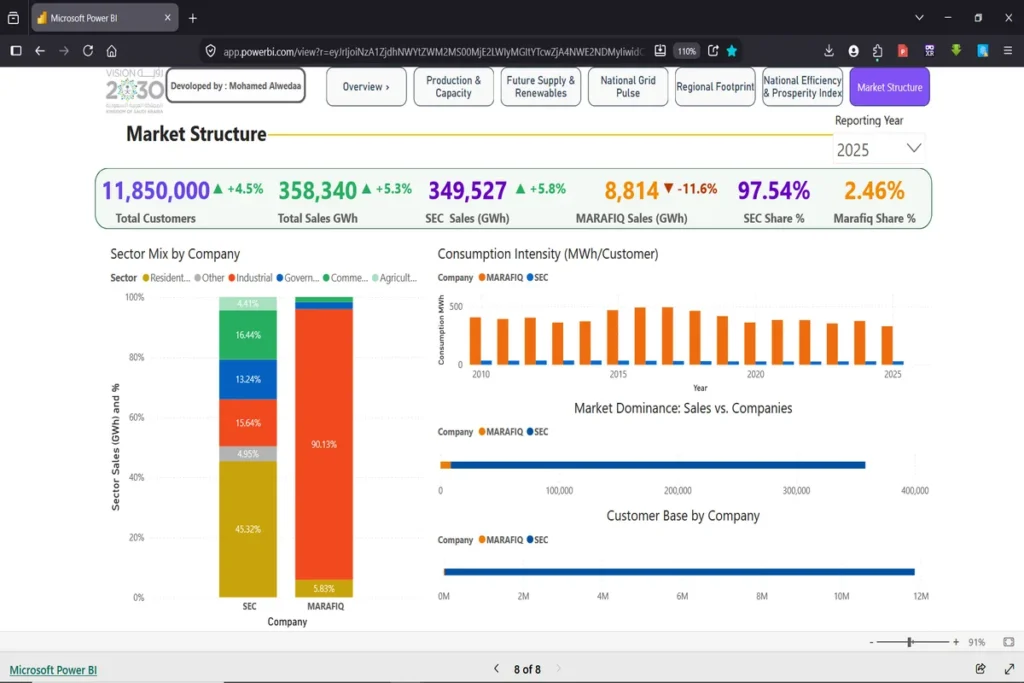
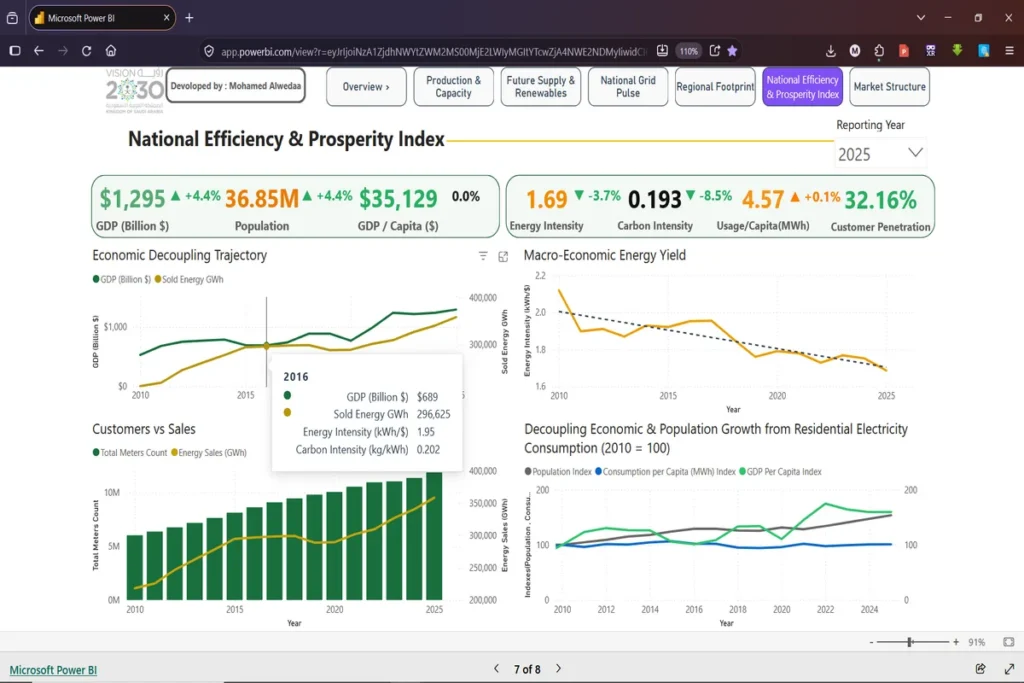
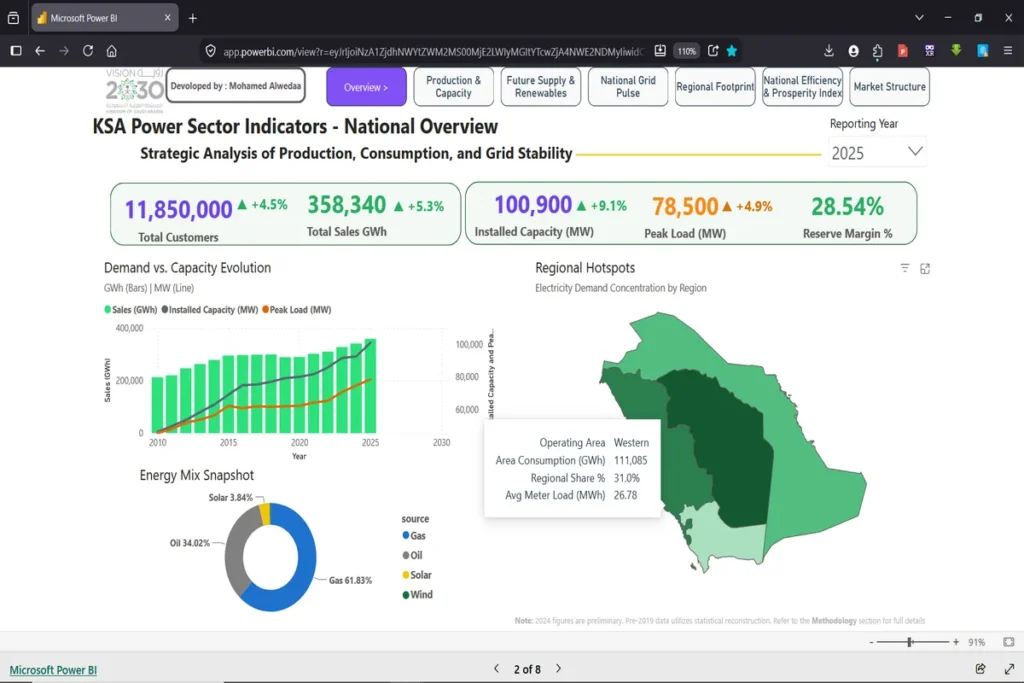
1. Saudi Arabia Energy Market Strategic Analysis — Power BI
Interactive multi-page Power BI dashboard analysing Saudi Arabia’s electricity and energy market. Built with Power Query, Star Schema modelling, DAX measures, KPI reporting, regional analysis, filters, and executive-level visualisation. The dashboard covers demand, generation capacity, peak load, reserve margin, energy mix, regional consumption, and energy efficiency.

Canada Energy Transition Analysis — Tableau & Data Analytics
Interactive Tableau project analysing Canada’s energy transition from 2008 to 2025 using energy, emissions, renewable generation, population, and economic data. Data preparation and analysis were completed with Excel and R, with Tableau used to visualise key trends, provincial comparisons, emissions intensity, and renewable-energy growth. This is a separate analytics project included to demonstrate broader data analysis and dashboard design experience beyond Power BI.
Extra Information
Tools & Technologies
Best Suited For
Service Details
Frequently Asked Questions
You can send Excel, CSV, or other structured data files. If you have multiple files or tables, please include all relevant sources and briefly explain how they relate to each other.
No. If you already know the KPIs you need, please provide them. If not, explain your reporting goals and business questions, and I can recommend suitable KPIs based on the available data.
Yes. Every package includes the editable Power BI PBIX source file so you can review, maintain, or continue developing the dashboard after delivery.
Yes, within the scope of the selected package. I can clean and transform structured business data using Power Query. If the dataset requires extensive restructuring, missing-data recovery, or complex preparation, I will confirm the scope before starting.
Usually no. For most projects, the required data files are enough. If direct access to a system or cloud source is necessary, this will be agreed in advance and only the minimum required access should be provided.
I can work with Excel, CSV, and other structured data files. If you have multiple files or tables, please include all relevant sources and briefly explain how they relate to each other.
Direct connections to sources such as SQL Server, SharePoint, Google Sheets, or other live data systems may also be possible, but these should be discussed before ordering because the setup, access requirements, and complexity can vary.
Power BI Service publishing or cloud sharing can be discussed when required. The exact setup depends on the buyer's Microsoft environment, available workspace access, permissions, and sharing requirements. Please contact me before ordering if online publishing or scheduled cloud-based reporting is part of your project.
Yes, direct or connected data sources may be supported depending on the system, access method, permissions, and refresh requirements. Please contact me before ordering if your project requires a live or direct connection so I can confirm the setup and scope.
Yes. To open and edit the PBIX source file, you will need Microsoft Power BI Desktop. Power BI Desktop is available as a free download from Microsoft.
Customer Reviews
See what our customers say about this Zinn
Categories
Zinner Policies
Related Zinns