A model-free tool that scans your time-series data, identifies which frequency bands contain structure, classifies each band into one of five types, and detects the exact moment when system behavior changes.

I Will Diagnose Your Time-Series Data with Automated Frequency Band Scanning and State Change Detection
Single dataset diagnostic report with automated band scanning and 5-class classification.
- Automated frequency band scanning
- Five-class classification (signal / segmented / white_noise / nonstationary / signal_low)
- Transition detection
- 3-panel visualization (raw signal, CV, entropy)
- CSV results table
Up to 3 datasets, full diagnostics with cross-dataset comparison.
- Cross-dataset structural comparison
- Transition timestamp comparison
- 2 rounds of Q&A
- Automated frequency band scanning
- Five-class classification (signal / segmented / white_noise / nonstationary / signal_low)
- Transition detection
- 3-panel visualization (raw signal, CV, entropy)
- CSV results table
Batch analysis and extended diagnostic report for up to 5 datasets.
- Cross-dataset structural comparison
- Transition timestamp comparison
- 2 rounds of Q&A
- Automated frequency band scanning
- Five-class classification (signal / segmented / white_noise / nonstationary / signal_low)
- Transition detection
- 3-panel visualization (raw signal, CV, entropy)
- CSV results table
- Batch processing
- Custom parameters
- Extended analysis report (additional metrics and comparisons)
- 3 rounds of Q&A
Request a Custom Offer
Log In to Request a Custom Offer
Create a free account or log in to request a personalised offer from this Zinner.
Log In / RegisterAsk a Pre-Sale Question
Log In to Ask a Question
To reduce platform spam, pre-sale messages can only be sent by logged-in users.
Create a free account or log in to message this Zinner directly.
Log In / RegisterAt a Glance
Key details about this service to help you decide. Generated by Zinn Hub, not the seller.
Value Position
Analysis Method
Output Type
Validated On
Best For
What You'll Receive
Full Description
WHAT THIS IS
This is a diagnostic tool for single-channel time-series data. It automatically:
- Finds the frequency bands that contain structure
- Classifies each band into one of five types
- Detects abrupt changes in system behavior
- Compares data from different time periods
It does NOT require labeled training data, pre-defined templates, or a physical model. It uses four independent statistical metrics: coefficient of variation, sample entropy, envelope skewness, and recurrence rate.
Academic reference: Zenodo preprint DOI 10.5281/zenodo.22837806
WHAT YOU GET
A diagnostic report (PDF) with:
- Per-band metrics: CV, sample entropy, skewness, recurrence rate
- Per-band classification
- Detected transition timestamps
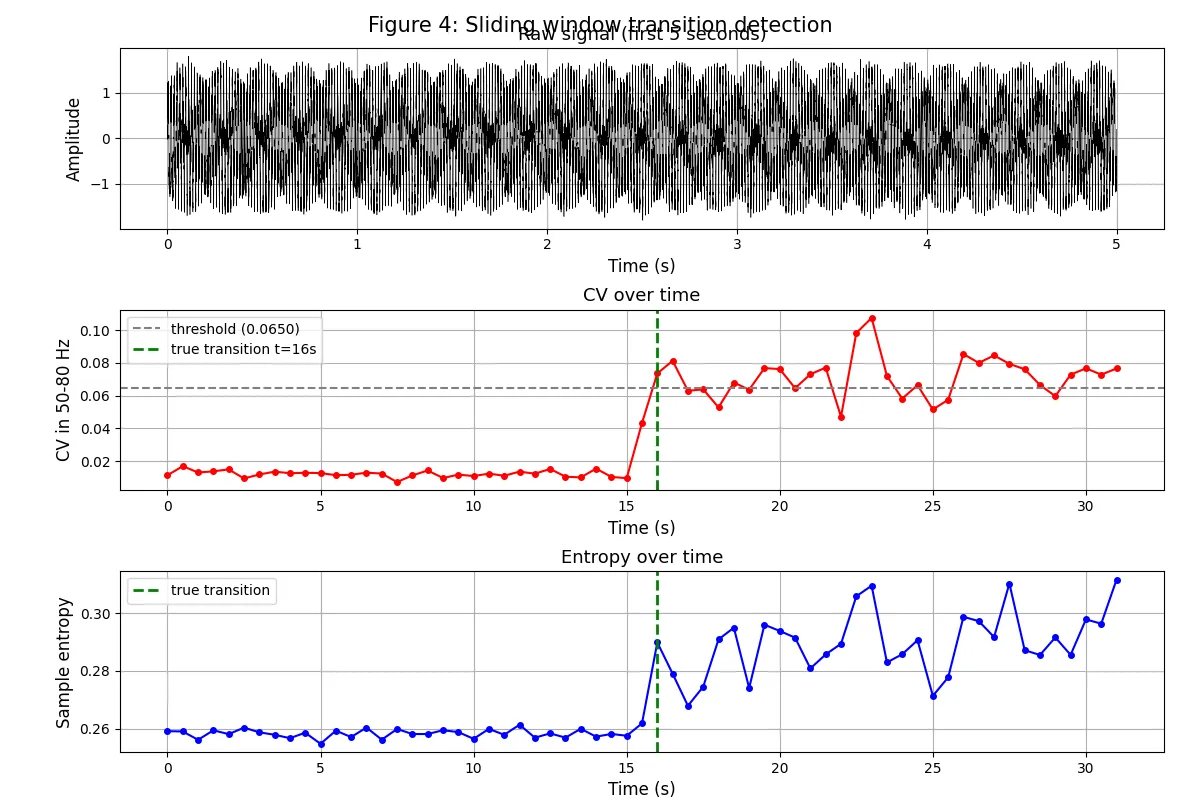
- Three-panel visualization (raw signal, CV over time, entropy over time)
A structured results table (CSV) containing all band metrics and labels.
A methodology note explaining the analysis flow, parameters, and how to read the results.
HOW IT WORKS — PLAIN ENGLISH
Think of your data as a radio signal. Traditional tools tell you "there is energy at 50-80 Hz." This tool tells you "the signal at 50-80 Hz is stable and structured" or "the signal at 50-80 Hz is changing in segments" or "that band is just random noise."
It also tells you the exact time when the behavior changed — for example: "at t=568 seconds, the system switched from stable to unstable."
FIVE CLASSIFICATION LABELS
- signal: stable, structured signal
- segmented: structured but changing in segments
- white_noise: flat, random noise
- nonstationary: random fluctuation
- signal_low: structure present, but data too short for full analysis
WHAT THIS TOOL CANNOT DO
- Cannot reconstruct the waveform shape
- Cannot locate a physical source
- Cannot predict the future
- Cannot process multi-channel data
- Cannot process data shorter than 500 points
- Cannot process data with a strong trend unless detrended first
WHAT YOU NEED TO PROVIDE
1. Your time-series data file
Format: CSV, TSV, TXT, or HDF5
Content: at least one numeric column (timestamp optional)
Length: 1000 points minimum (5000+ recommended)
2. Sampling rate
Examples: one sample per second, one per millisecond, LIGO 16384 Hz
3. Your goal
Examples:
- Find which frequency band contains a signal
- Detect the exact time of a state change
- Compare structure between two data periods
WHEN TO USE IT
- You have a long, single-channel time series
- You suspect the system behavior changed at some point
- You want to distinguish "power glitch" from "structural change"
- You need an automated first-pass screening before deeper analysis
WHEN NOT TO USE IT
- Real-time streaming
- Multi-sensor arrays
- You need physical explanation
- You need fault localization
- You need future prediction
PRICING
- Basic: one dataset, report + CSV (contact for quote)
- Standard: up to 3 datasets, comparative analysis, one Q&A round
- Advanced: batch analysis, custom parameters, source code license
FAQ
Q: How is this different from FFT / PSD?
A: PSD tells you "how much power at each frequency." This tool tells you "what kind of structure is at each frequency, and when it changes."
Q: Can it locate the fault?
A: No. It only has one-dimensional time-series data, no spatial information. It tells you "the structure changed," not "where it changed."
Q: What is the time precision?
A: Depends on window length. With a 1-second window, transition detection is accurate to about ±1 second.
Q: Can it handle my data?
A: First check: length ≥ 1000 points, no strong trend, and a clear change expected. If so, it should work. If not, the tool will tell you it cannot analyze.
Zinner Quality Guarantee
Every Zinner is reviewed and approved before joining the platform.
All services are backed by our quality assurance commitment.
Your payment is protected until you approve the delivered work.
Compare Packages
| 特色 | 基本诊断 | 标准诊断 | 高级诊断 |
|---|---|---|---|
| 交付时间 | 5天 | 7天 | 10天 |
| 修订 | 1 | 2 | 3 |
| 自动频带扫描 | ✓ | ✓ | ✓ |
| 五级分类(信号/分段/white_noise/非固定/signal_low) | ✓ | ✓ | ✓ |
| 过渡检测 | ✓ | ✓ | ✓ |
| 三面板可视化(原始信号、CV、熵) | ✓ | ✓ | ✓ |
| CSV 结果表 | ✓ | ✓ | ✓ |
| 跨数据集结构比较 | ✕ | ✓ | ✓ |
| 过渡时间戳比较 | ✕ | ✓ | ✓ |
| 两轮问答环节 | ✕ | ✓ | ✓ |
| 批量处理 | ✕ | ✕ | ✓ |
| 自定义参数 | ✕ | ✕ | ✓ |
| 扩展分析报告(附加指标和比较) | ✕ | ✕ | ✓ |
| 3轮问答环节 | ✕ | ✕ | ✓ |
Samples
View examples of the seller's work related to this Zinn.
Portfolio
Examples of the seller's work related to this Zinn.
LIGO O4c1 Noise Structure Analysis
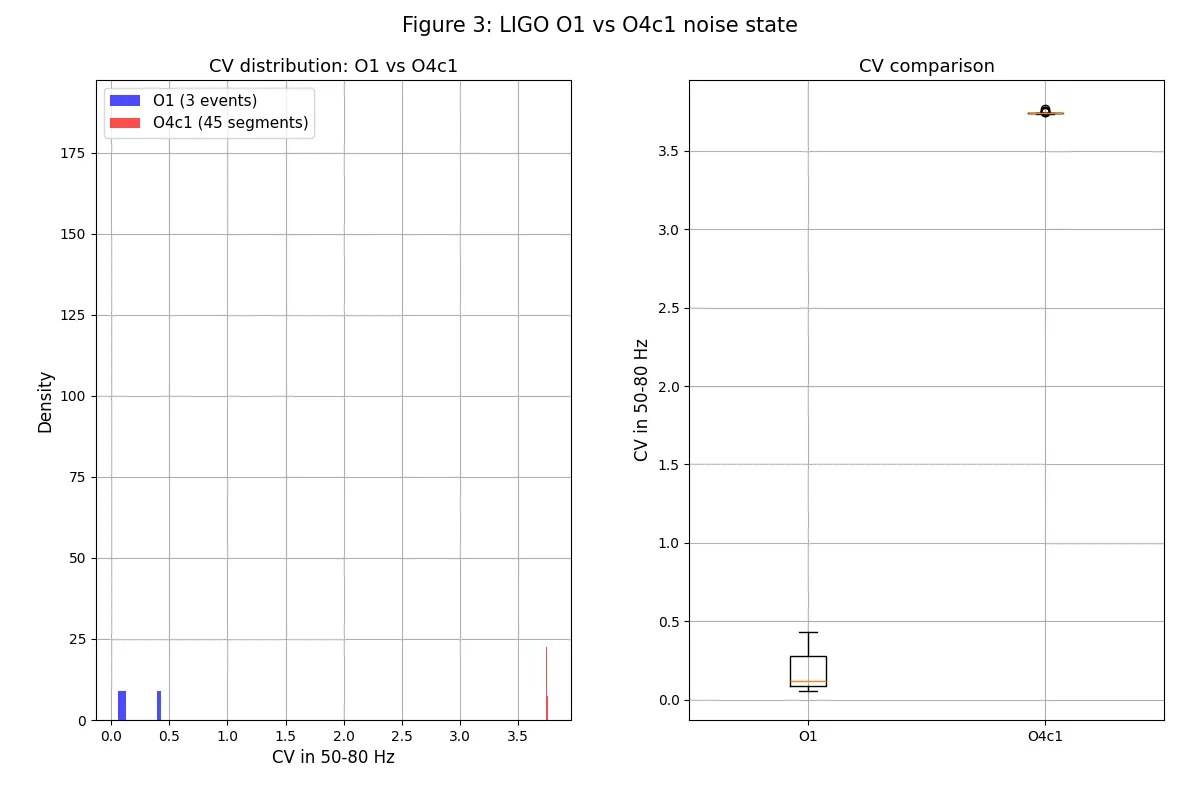
Applied the diagnostic tool to 24 minutes of LIGO O4c1 continuous data. Detected 4 transient events and quantified the noise structure baseline.
Extra Information
Workflow
Scope & Limitations
Tech Stack & Validation
Service Details
Frequently Asked Questions
No. This is a diagnostic tool, not a forecasting tool. It analyzes historical/current data to detect structural changes and state transitions. It cannot predict future behavior.
No. The tool outputs statistical structures (CV, entropy, skewness, recurrence rate) and 5-class labels. It does NOT reconstruct the exact signal shape or waveform.
No. Currently, the tool supports single-channel time series only. It does not perform multi-sensor fusion or spatial localization.
No. This is an offline analysis tool designed for historical data and batch processing. It is not designed for real-time streaming.
The method uses sliding window analysis (e.g., 32s window, 8s step). Due to window smoothing effects, transitions may be detected slightly after the true event (e.g., in our validation, true transition at t=16s, detected peak at t=22s). This is normal and will be noted in the report.
No. This is a service-based listing. You will receive the diagnostic report, CSV tables, and PNG visualizations, but the source code (Python scripts) is NOT included in any package.
Customer Reviews
See what our customers say about this Zinn