
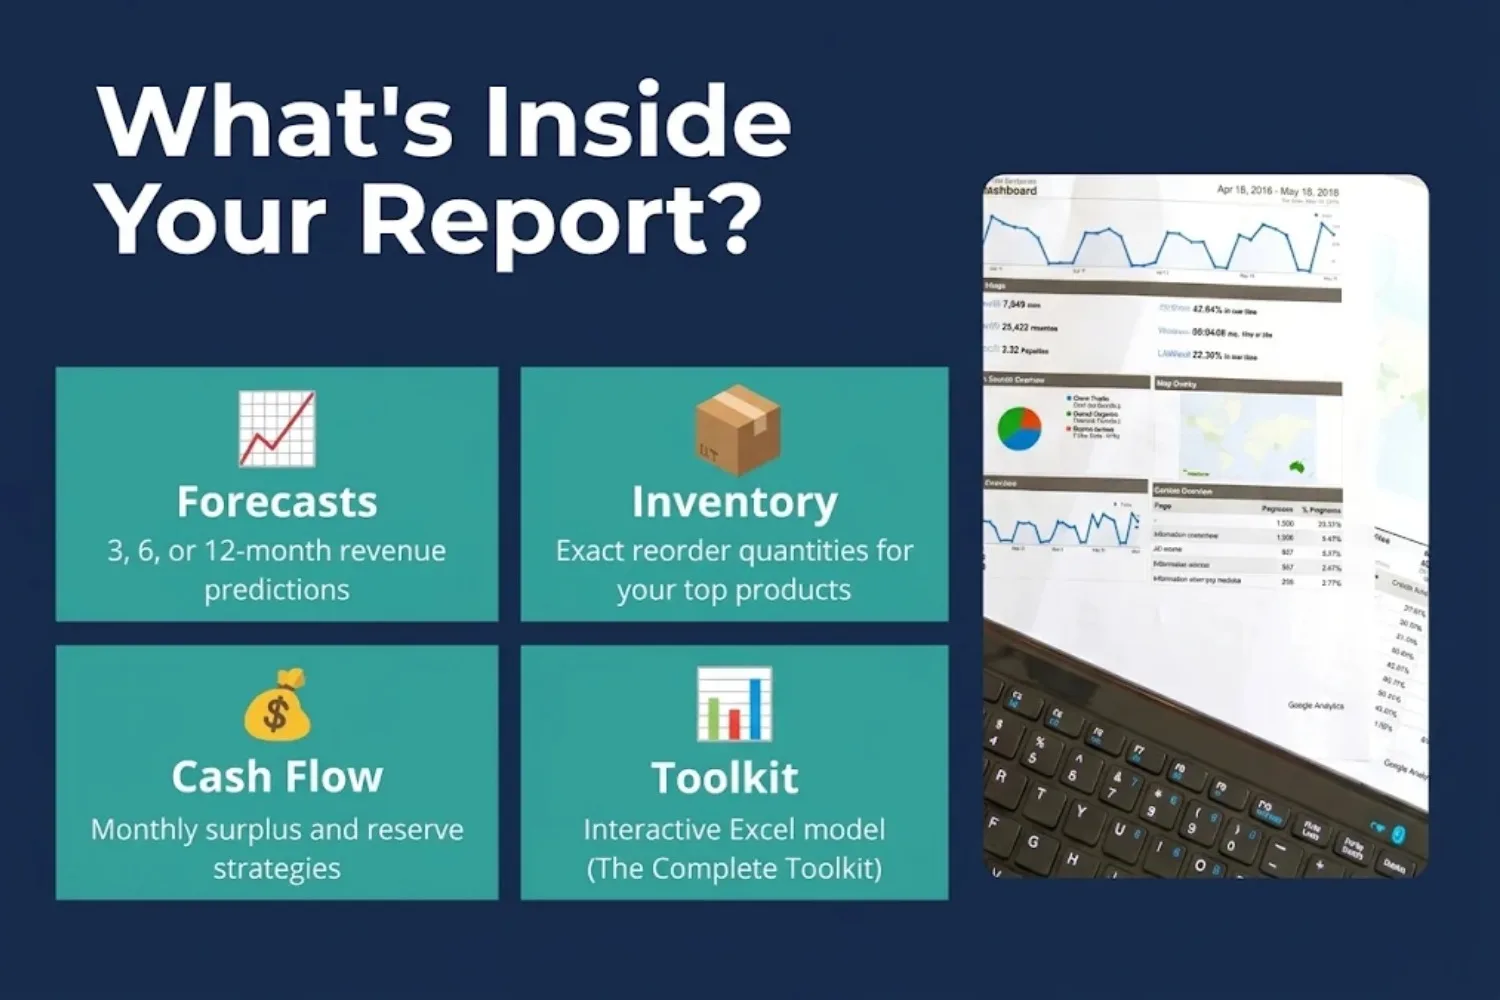
I will analyze your historical data to build a multi-month sales forecast and a precise inventory reorder plan. Stop guessing how much stock to buy—know your peak months, cash flow needs, and exact stock-up quantities before the season hits.

I Will Build a Seasonal Sales Forecast and Inventory Reorder Plan From Your Data
3-month sales forecast, seasonal peak breakdown, and a specific stockup strategy for your busiest month.
- 3-Month Sales Forecast (with Dollar Ranges)
- Seasonal Breakdown (Peak & Trough Months)
- Specific Stockup Strategy for Busiest Month
- Decision-Ready PDF Report (4-5 Pages)
- Full Data Preparation & Cleaning (Included)
A 6-month sales forecast with category-level breakdowns, a full inventory reorder plan with safety stock, and a strategic action plan. Includes a 7-8 page decision-ready PDF.
- 6-Month Sales Forecast
- Category-Level Breakdown (Identify Peak Drivers)
- Inventory Reorder Plan (with Safety Stock)
- Strategic Action Plan
- Decision-Ready PDF Report (7-8 Pages)
- Full Data Preparation & Cleaning (Included)
The complete toolkit: 12-month forecast, cash flow modeling, custom Excel dashboard, annual reorder calendar, and a live 1-hour strategy call. Includes a 10-15 page report.
- 12-Month Sales Forecast
- 12-Month Cash Flow Forecast (Surplus vs. Reserve)
- Annual Reorder Calendar
- 12-Month Strategic Roadmap
- Custom 3-Tab Interactive Excel Dashboard
- Decision-Ready PDF Report (10-15 Pages)
- 1-Hour Strategy Call (Live walkthrough and Q&A)
- Full Data Preparation & Cleaning (Included)
Request a Custom Offer
Log In to Request a Custom Offer
Create a free account or log in to request a personalised offer from this Zinner.
Log In / RegisterAsk a Pre-Sale Question
Log In to Ask a Question
To reduce platform spam, pre-sale messages can only be sent by logged-in users.
Create a free account or log in to message this Zinner directly.
Log In / RegisterAt a Glance
Key details about this service to help you decide. Generated by Zinn Hub, not the seller.
Value Position
Forecasting Method
Confidence Range
Data Required
Best For
What You'll Receive
Full Description
This service analyzes historical sales data to project future revenue, calculate exact inventory reorder quantities, and forecast your cash flow. Deliverables are provided as decision-ready PDF reports and Excel trackers.
Unlike a simple trend line, this model accounts for seasonality. If you manage inventory, staff, or cash flow, guessing costs you. This service tells you exactly when your peak is coming, how much stock to buy, and how much cash you will need.
─────────────────────────────────────────────────────────────
WHAT YOU GET
─────────────────────────────────────────────────────────────
-
Month-by-month sales forecast with confidence ranges (low, expected, high).
-
Seasonal peak and trough breakdown.
-
Inventory reorder plan (demand quantities, safety stock buffers).
-
Cash flow projections (surplus vs. reserve months).
-
Excel tracking dashboard (Tier 3 only).
-
All-Inclusive Data Preparation & Cleaning (Send raw files—I will clean them).
─────────────────────────────────────────────────────────────
THE TIERS
─────────────────────────────────────────────────────────────
Tier 1 — The Snapshot
-
3-Month Forecast + Full Seasonal Breakdown.
-
Specific Stockup Strategy for your busiest month.
-
4-5 Page Decision-Ready PDF.
Tier 2 — The Deep Dive (Best Value)
-
Everything in Tier 1.
-
6-Month Forecast.
-
Category-Level Breakdown (know exactly what to buy).
-
Full Inventory Reorder Plan with safety stock.
-
7-8 Page Decision-Ready PDF.
Tier 3 — The Complete Toolkit
-
Everything in Tier 2.
-
12-Month Forecast.
-
Annual Reorder Calendar (full year strategy).
-
12-Month Cash Flow Forecast (surplus vs. reserve).
-
Custom 3-Tab Interactive Excel Dashboard.
-
10-15 Page Decision-Ready PDF.
-
1-Hour Strategy Call with me.
─────────────────────────────────────────────────────────────
TARGET BUSINESSES
─────────────────────────────────────────────────────────────
-
Retailers planning inventory cycles.
-
E-commerce sellers preparing for peak seasons.
-
Wholesalers managing supplier lead times.
─────────────────────────────────────────────────────────────
METHODOLOGY
─────────────────────────────────────────────────────────────
-
Recency-Weighted Seasonal Model: Recent 12 months are weighted at 3x the impact of older data to ensure forecasts reflect current market conditions, not historical baselines.
-
Statistical Rigour: Every forecast includes a ±12% confidence range so you can plan for uncertainty.
-
Privacy First: Data is processed locally. No third-party data sharing. Deleted within 7 days.
─────────────────────────────────────────────────────────────
INPUT REQUIREMENTS
─────────────────────────────────────────────────────────────
-
Sales data in Excel or CSV format.
-
Minimum 12 months of history (24+ months recommended for Tier 3).
-
Required columns: Date, Sales Amount.
-
Optional: Product Name, Category, Cost.
─────────────────────────────────────────────────────────────
TERMS & POLICIES
─────────────────────────────────────────────────────────────
-
Proprietary Code: Source code and backend algorithms are not shared.
-
Data Cleaning Clause: Data cleaning includes standard formatting. If a dataset is exceptionally large or severely corrupted, I will contact you to discuss a custom quote or revised timeline before starting.
─────────────────────────────────────────────────────────────
PROCESS
─────────────────────────────────────────────────────────────
-
Buyer provides data via ZinnHub chat (Raw Excel/CSV is fine).
-
Analyst cleans data, builds forecast model, and generates inventory plan.
-
Deliverables (PDF / Excel) are delivered via Order Manager within the selected package timeline.
─────────────────────────────────────────────────────────────
NOT READY FOR A FULL FORECAST?
If you just want to know which single month will be your busiest next quarter, try my "Quarterly Peak Predictor" Micro Zinn. It's a quick, low-cost way to test my forecasting accuracy before committing to the full package.
Zinner Quality Guarantee
Every Zinner is reviewed and approved before joining the platform.
All services are backed by our quality assurance commitment.
Your payment is protected until you approve the delivered work.
Compare Packages
| Feature | The Snapshot | The Deep Dive | The Complete Toolkit |
|---|---|---|---|
| Delivery Time | 3 days | 5 days | 7 days |
| Revisions | 1 | 1 | 2 |
| Data Prep & Cleaning | ✓ | ✓ | ✓ |
| Forecast Scope | 3 Months | 6 Months | 12 Months |
| Forecasted Sales (Dollar Ranges) | ✓ | ✓ | ✓ |
| Seasonal Breakdown (Peak/Trough) | ✓ | ✓ | ✓ |
| Specific Stockup Strategy | ✓ | ✓ | ✓ |
| Category-Level Breakdown | ✕ | ✓ | ✓ |
| Inventory Reorder Plan | ✕ | 6-Month | Annual |
| Safety Stock Recommendations | ✕ | ✓ | ✓ |
| Strategic Action Plan | ✕ | ✓ | ✓ |
| 12-Month Cash Flow Forecast | ✕ | ✕ | ✓ |
| Custom 3-Tab Excel Dashboard | ✕ | ✕ | ✓ |
| 1-Hour Strategy Call (Live walkthrough and Q&A) | ✕ | ✕ | ✓ |
| Decision-Ready PDF Report | 4-5 Pages | 7-8 Pages | 10-15 Pages |
Portfolio
Examples of the seller's work related to this Zinn.
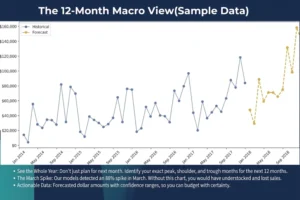
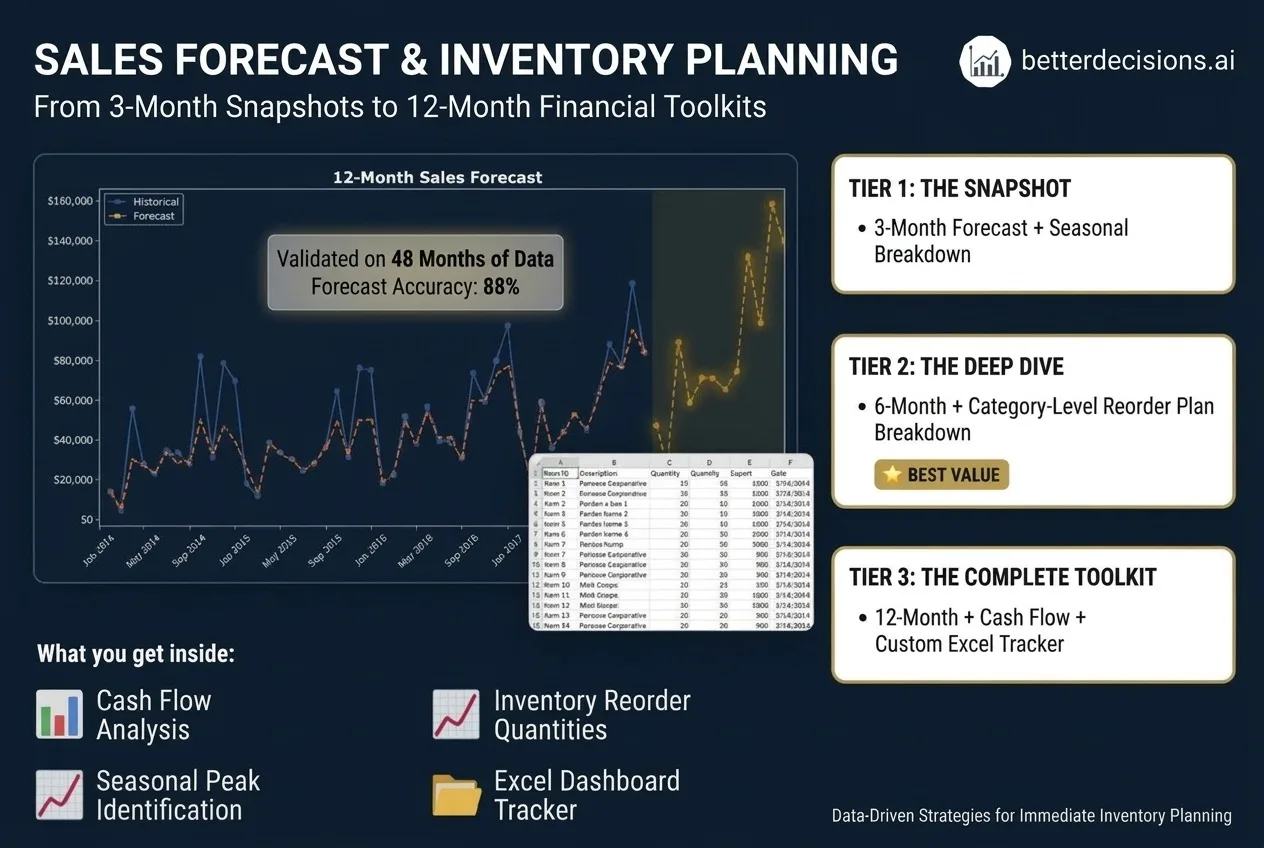
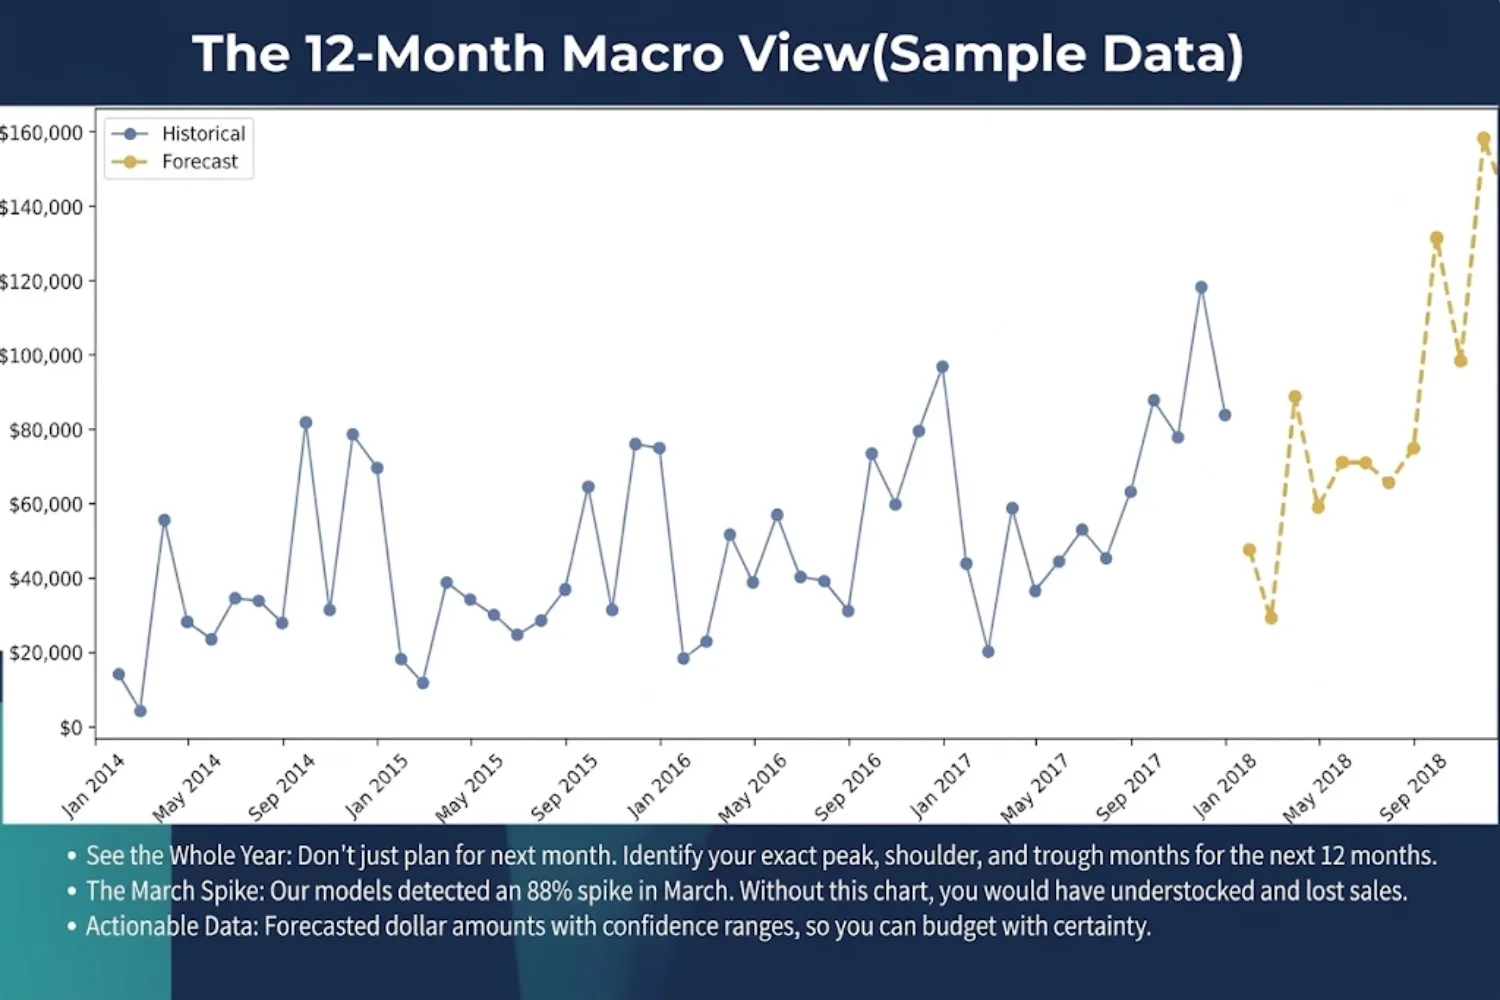
12-Month Sales Forecast & Macro Trend Analysis (Sample Data)
This project demonstrates a 12-month predictive sales forecast built on 48+ months of historical data. The model identifies exact peak, shoulder, and trough months, providing actionable dollar-range projections. This allows the client to budget with certainty, catch seasonal spikes early, and prevent understocking. (Note: Charts show anonymized sample data to demonstrate the analytical framework).
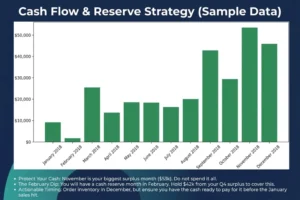
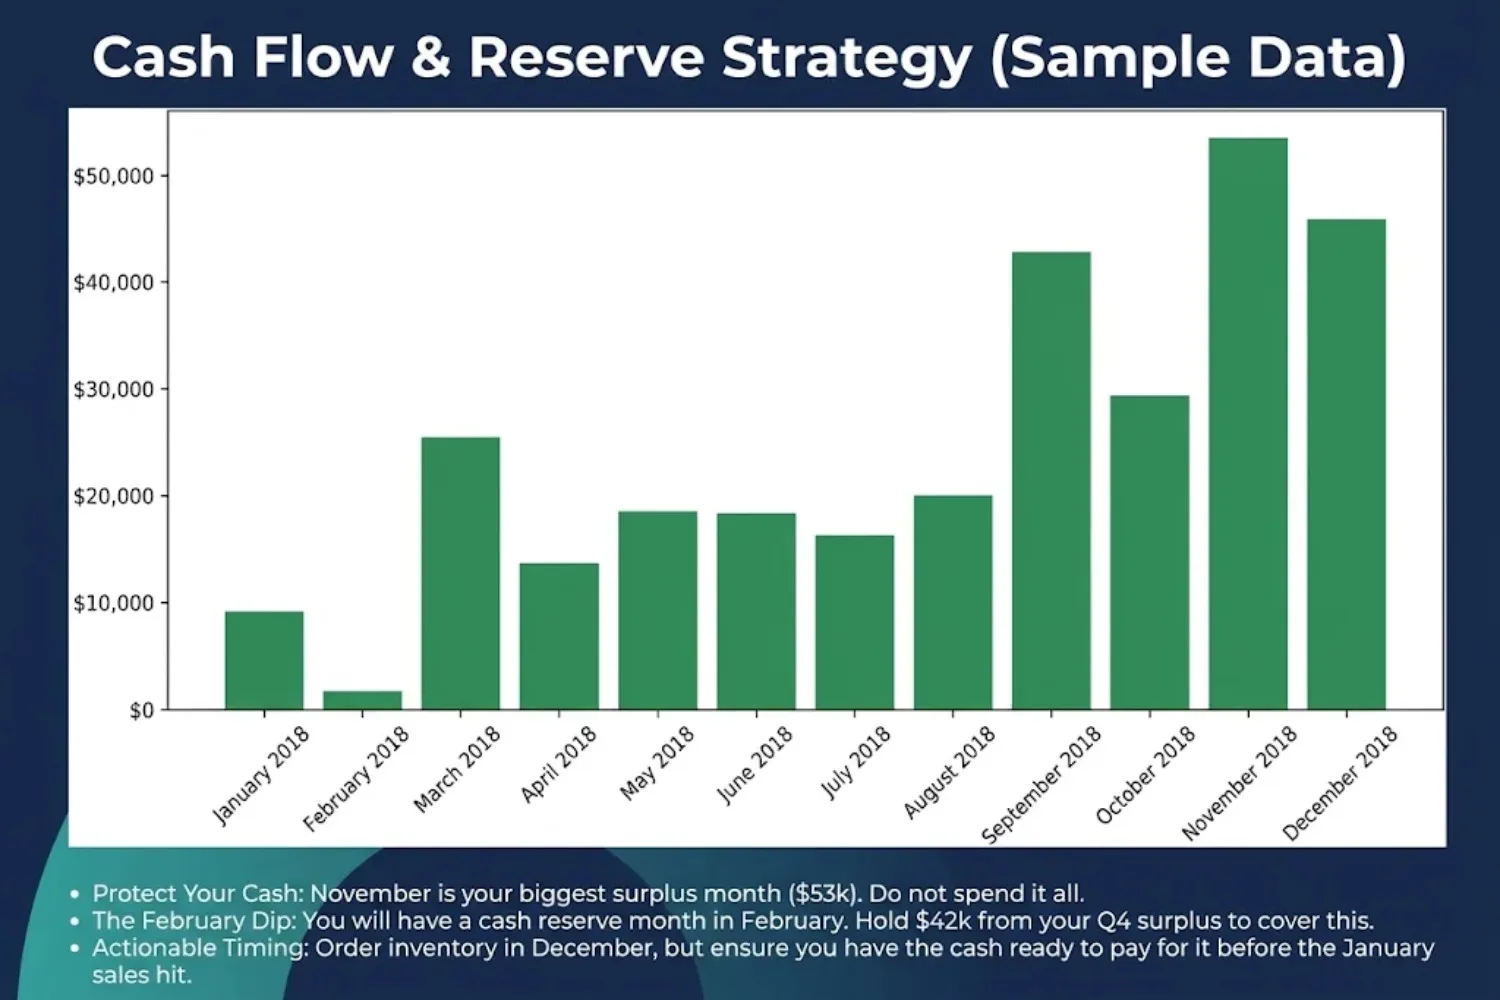
Cash Flow & Reserve Strategy + Interactive Excel Dashboard (Sample Data)
The Complete Toolkit includes a 12-month cash flow forecast highlighting surplus vs. reserve months. In this sample, it identified November as the biggest surplus month ($53k) and February as a reserve month, advising the client to hold $42k for Q4. This tier also includes a custom Excel dashboard for real-time tracking. (Note: Charts show sample data. The actual Excel file is delivered privately to the client).
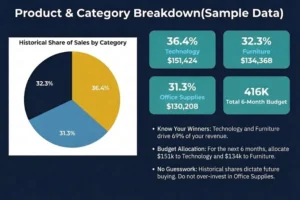
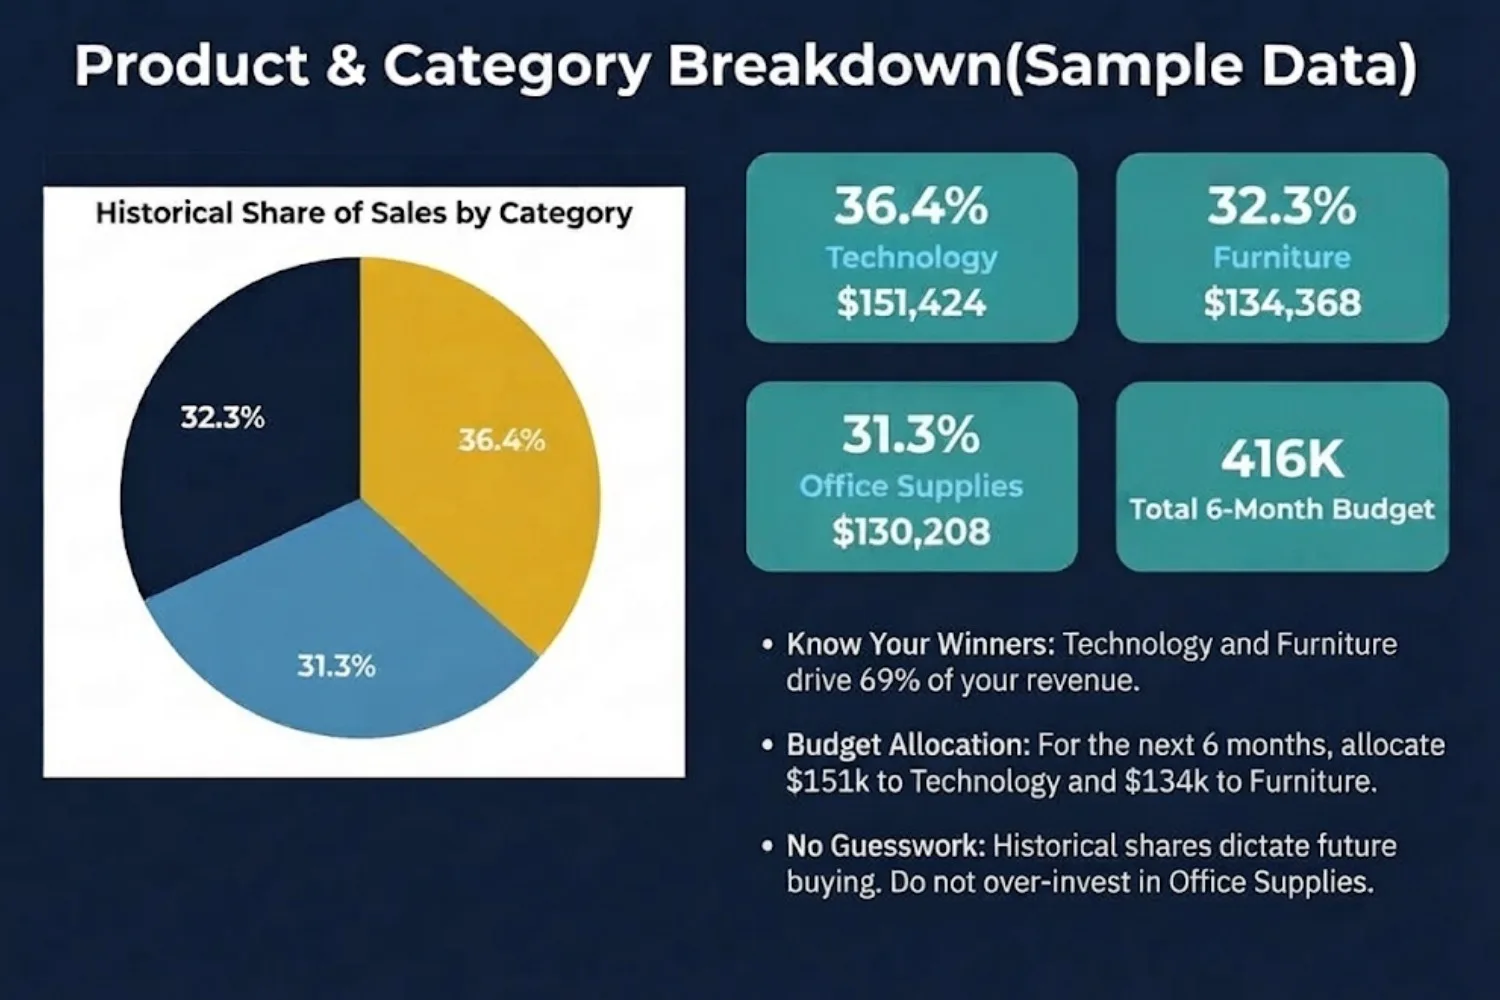
Product & Category Breakdown for Inventory Optimization (Sample Data)
This deep-dive analysis breaks down historical sales shares by product category to inform future buying decisions. By identifying that Technology and Furniture drive 69% of revenue, the client could allocate a $416K budget strategically. The report includes exact reorder quantities to avoid over-investing in low-performing categories. (Note: Charts show anonymized sample data to demonstrate the framework).
Extra Information
My Process (How it Works)
Tools & Methodology
Revision
Add-On
Source Files & Intellectual Property
Data Safety & Security
Scope Limitations
Why Choose This Service?
Service Details
Frequently Asked Questions
You need at least 12 months of historical sales data in an Excel or CSV file. The file must contain a Date column and a Sales/Revenue column. If you have product categories, that is a bonus (required for The Deep Dive and The Complete Toolkit). Standard data cleaning and formatting are included in all tiers, so don't worry if your file is a bit messy.
No. All tiers include All-Inclusive Data Preparation & Cleaning. You can simply upload your raw Excel or CSV export, even if it has duplicates, blank rows, or mixed date formats. I will clean, validate, and format the data before building the forecast.
I require a minimum of 12 months to accurately detect your seasonal patterns. If you have less than 12 months, I cannot guarantee the accuracy range. Please message me before ordering so we can discuss a custom solution.
I base the forecast on the last date in your dataset. For example, if your data ends in September, your next 3 months are October, November, and December. If your data ends in March, it will forecast April, May, and June.
Yes, but please message me before ordering. While daily or transactional data is best for the sharpest accuracy, I can work with monthly totals as long as you have at least 24 months of history.
If your data doesn't have a Category or Product Name column, you will only be eligible for The Snapshot (Tier 1). If you select Tier 2 or 3 without this column, I will contact you before starting to either request the column or adjust your order to Tier 1.
Every forecast includes a confidence range (±12%) because no model can predict the future with 100% certainty. Your accuracy depends heavily on how much history you send. Sending 12–23 months gives basic peak detection (~80% accuracy), while 24+ months gives the sharpest peak detection (~88% accuracy)
My predictive models are validated on 48+ months of historical sales data across multiple industries like retail apparel, e-commerce, and consumer packaged goods (CPG). While no forecast can predict random events (like a pandemic or a sudden viral trend), a ±12% variance is an industry-standard benchmark for seasonal retail forecasting
I use a statistical Recency-Weighted Seasonal Model to calculate the math. However, every report is manually reviewed and written by me. I check the confidence intervals and verify the patterns before writing your strategic recommendations. You are paying for statistical rigor and plain-English analysis, not an automated AI output.
No. The forecast is a statistical projection based on historical seasonality. It is designed to give you a directional guide for inventory and cash flow planning—not a guarantee of future revenue. External factors (economy, viral trends, new competitors) can always shift actual results.
The forecast is based on your historical patterns. If your actuals are wildly different, it usually means a major external factor changed (e.g., you launched a massive new ad campaign, or a competitor shut down). If this happens, I recommend booking a new forecast for the next quarter to adjust for the new baseline.
The charts and reports shown in my gallery are based on anonymized/sample datasets to demonstrate the analytical framework, layout, and quality of the deliverables you will receive. Your report will be custom-built using your specific data.
The Snapshot (3-Month): Gives you a quick snapshot of the upcoming quarter with exact dollar ranges and your peak month. Perfect for immediate inventory stock-up.
The Deep Dive (6-Month): Gives you half a year of visibility, plus a breakdown of which specific products will drive those sales.
The Complete Toolkit (12-Month): Gives you a full-year roadmap, including a cash flow projection (so you know when you'll have surplus cash vs. when you need to reserve it) and a custom Excel dashboard.
It is a live, 1-on-1 video call where I walk you through your 12-month roadmap, explain how to use your custom Excel dashboard, and answer any questions you have about executing your inventory plan. (Note: This call must be scheduled within 7 days of final delivery).
The Snapshot and Deep Dive include a Decision-Ready PDF Report. The Complete Toolkit includes the PDF Report plus the Custom 3-Tab Interactive Excel Dashboard. If you want the raw, cleaned data tables and Excel forecast model to play with yourself, you can purchase the "Raw Cleaned Data & Excel Forecast Tables" add-on at checkout. I don't provide the backend scripts used to generate the forecast, as they're proprietary to my forecasting framework.
If you select this add-on, you will receive your fully cleaned and validated data (so you can reuse it for your own records), the original charts in PDF format, and the original tables in CSV format. This is perfect if you want to plug the numbers into your own internal software or reuse the visuals in your own materials. Note: Tier 3 already includes the Interactive Dashboard; this add-on gives you the flat files behind it.
Delivery depends on your tier:
The Snapshot: 3 Days
The Deep Dive: 5 Days
The Complete Toolkit: 7 Days
(If you need it faster, you can purchase one of the Express Delivery add-ons at checkout.)
A revision is for formatting changes, chart styling, or correcting a data oversight — for example: "Can you switch this chart to a bar chart?" or "I forgot to include my December sales, can you rerun it?"
A revision is not for changing the scope of the project — for example: "Actually, can we look at a 6-month forecast instead of 3 months?" Scope changes require a new order or an add-on.
Important: Because the forecast is mathematically generated from your data, revisions cannot be used to manually "increase the forecast numbers" or alter the statistical output.
Every tier includes 1 free revision (Tier 3 includes 2). Extra Revision Rounds are only available for The Deep Dive and The Complete Toolkit.
Express Delivery Level 1 is available for all tiers.
Express Delivery Levels 2 & 3 are only available for The Deep Dive and The Complete Toolkit.
Extra Revisions are only available for The Deep Dive and The Complete Toolkit.
If you purchase an ineligible add-on, I will message you before starting to adjust the order.
Yes. Your data is processed locally on my secure machine and is never shared with third parties or used to train public AI models. All source files are permanently deleted within 7 days of delivery.
I can comfortably handle datasets up to 10,000 rows (which typically covers 500+ SKUs or product categories). If your file is larger than this, or if you have a very complex multi-tab structure, please message me before ordering so I can confirm the timeline and ensure a smooth delivery.
Customer Reviews
See what our customers say about this Zinn