Operational risk data is only useful when it is visible. If your team is still hunting through spreadsheets to work out whether a supplier is reliable or an inventory level is dangerously low, you are reacting to problems rather than…

I will build a basic Risk Management Dashboard for your business
Request a Custom Offer
Log In to Request a Custom Offer
Create a free account or log in to request a personalised offer from this Zinner.
Log In / RegisterAsk a Pre-Sale Question
Log In to Ask a Question
To reduce platform spam, pre-sale messages can only be sent by logged-in users.
Create a free account or log in to message this Zinner directly.
Log In / RegisterAt a Glance
Key details about this service to help you decide. Generated by Zinn Hub, not the seller.
Value Position
What You Get
Delivery Time
What to Prepare
Why It's Offered
Full Description
Operational risk data is only useful when it is visible. If your team is still hunting through spreadsheets to work out whether a supplier is reliable or an inventory level is dangerously low, you are reacting to problems rather than preventing them — and that costs time and money. A clear, interactive gauge built directly in Python and Streamlit puts a single critical metric front and centre, so the right person can see the status at a glance without any technical knowledge.
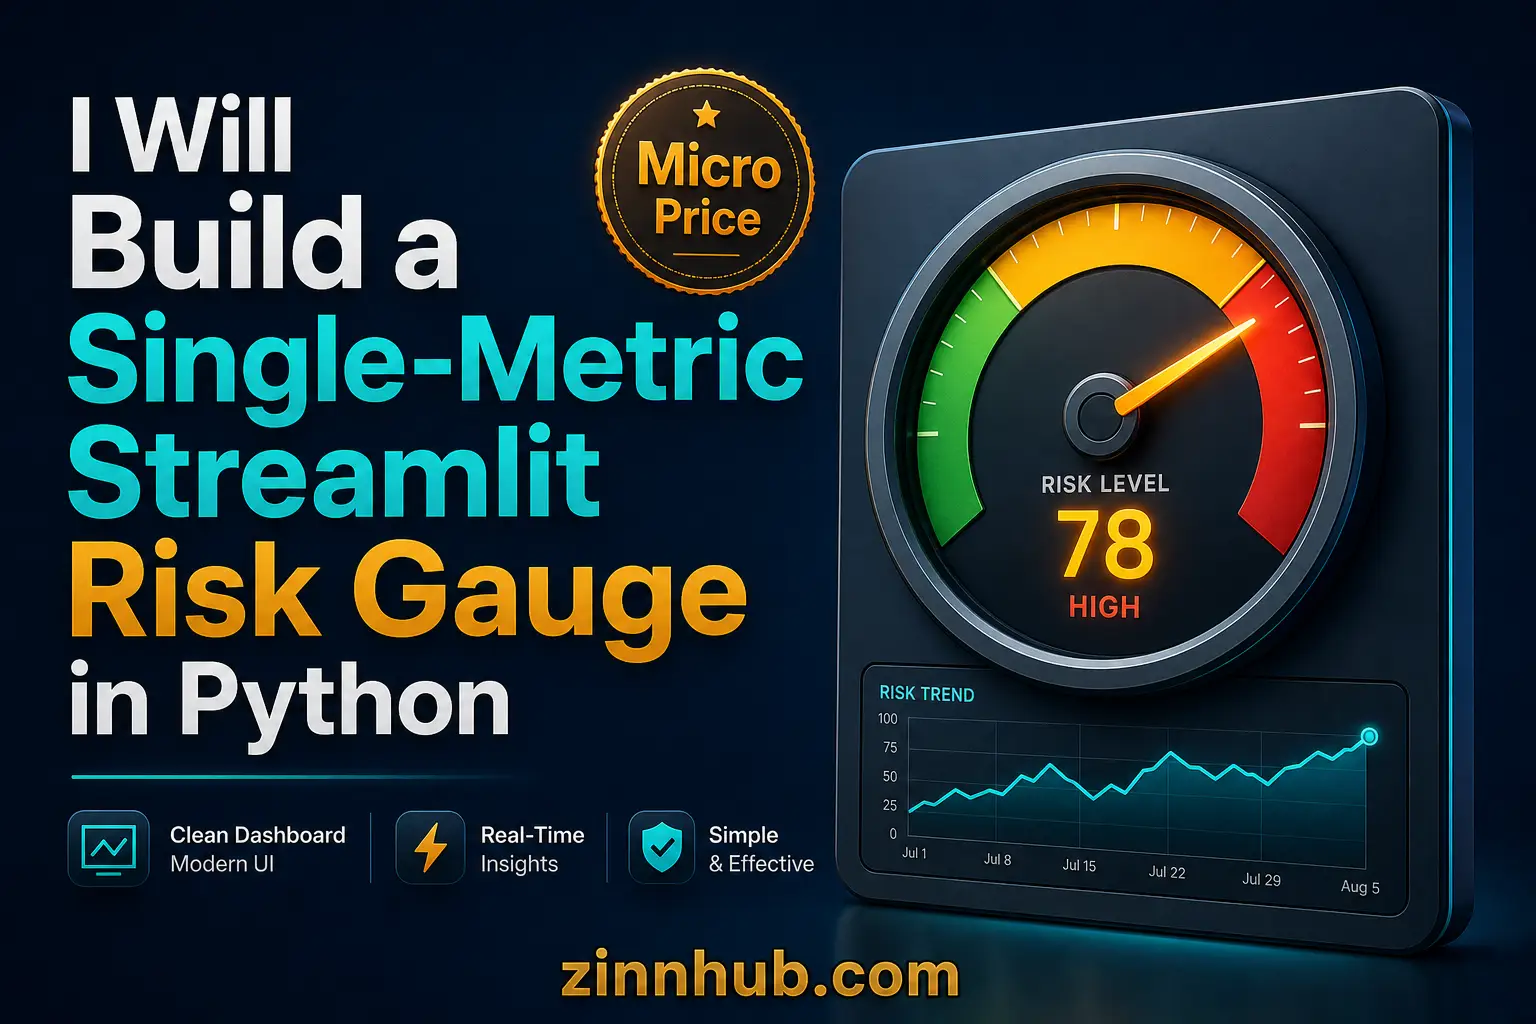
This micro delivers one fully functional Streamlit gauge panel tracking a single risk metric of your choice — inventory level, supplier reliability score, production output, delivery delay rate, or cost variance. The gauge displays a colour-coded status indicator (green, amber, red thresholds), a current value readout, and a simple trend line based on your uploaded data. It is built in clean, well-commented Python, runs locally or on Streamlit Community Cloud, and is ready to embed into a larger dashboard later.
To get started, simply share a sample CSV or Excel file containing your metric data (at least two columns: date and value), confirm which metric you want tracked, and specify your preferred threshold values for each status colour. You do not need to write a single line of code — just supply the data and the brief. Work begins promptly once requirements are confirmed, and the completed files are delivered via the order manager within the agreed timeframe.
This gauge is a genuine working slice of the full industrial risk management dashboard service, which covers five risk categories, a secure login system, automated PDF reporting, and bespoke KPI engines for complex manufacturing operations. Trying this taster gives you a tangible, deployable component you can use immediately — and a clear sense of exactly what the full build will deliver.
Full bespoke industrial risk management dashboard in Python and Streamlit, tracking five risk categories including supplier reliability, inventory, production, delivery delays, and cost fluctuations — with login, PDF reporting, and a complete user gu
View example ↗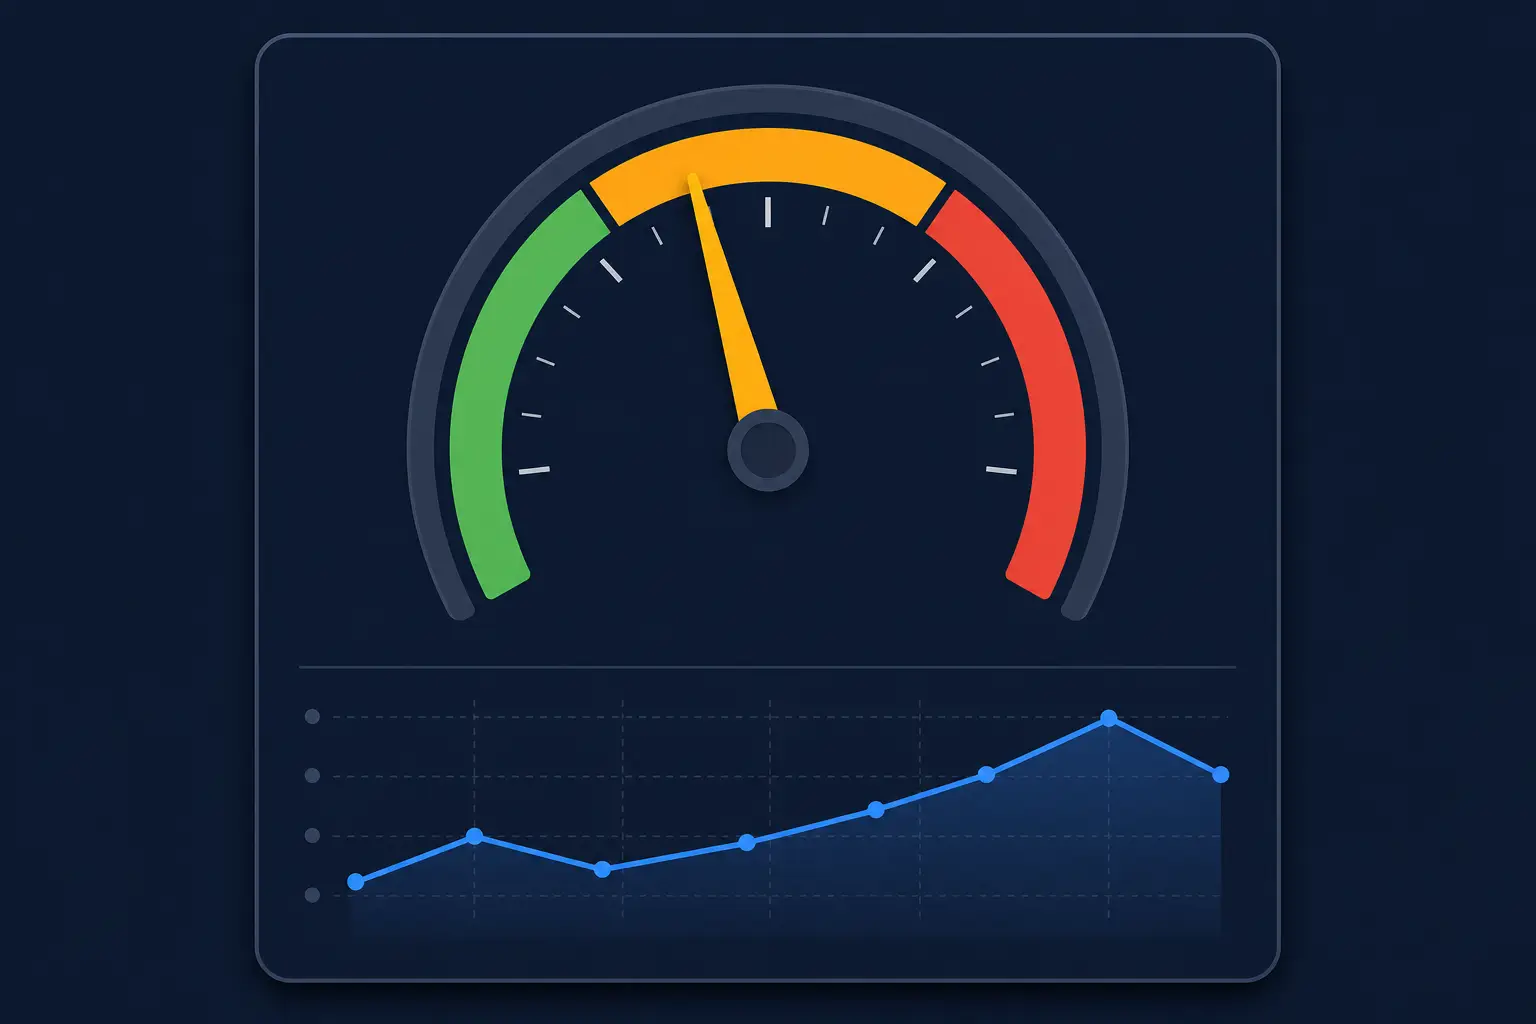
An illustration of the kind of result this Micro Zinn delivers.
A Micro Zinn is a small, fixed-price taster or micro service. faizahanif192 is offering this one for:
Skills showcaseService taster →Zinner Quality Guarantee
Every Zinner is reviewed and approved before joining the platform.
All services are backed by our quality assurance commitment.
Your payment is protected until you approve the delivered work.
Customer Reviews
See what our customers say about this Zinn