I provide rapid climate-warming response diagnosis for mountain watersheds using my self-developed SRF-SEI anchoring framework. I identify watershed anchor types and detect whether they are approaching state transitions. Validated across 78 US watersheds and 14,406 Chinese mountain grid points. 5 business days turnaround.

I Will diagnose your watershed's climate sensitivity using the SRF-SEI framework
Fast 1-page watershed warming sensitivity screening report.
- SRF snow reliance calculation
- SEI warming trend analysis
- Anchor type classification
- Simple sensitivity judgment
- 2-page PDF report
- Concise screening conclusion
Complete 5–10 page professional climate response diagnostic report.
- SRF snow reliance calculation
- SEI warming trend analysis
- Anchor type classification
- Simple sensitivity judgment
- 30–60 year SEI trend analysis
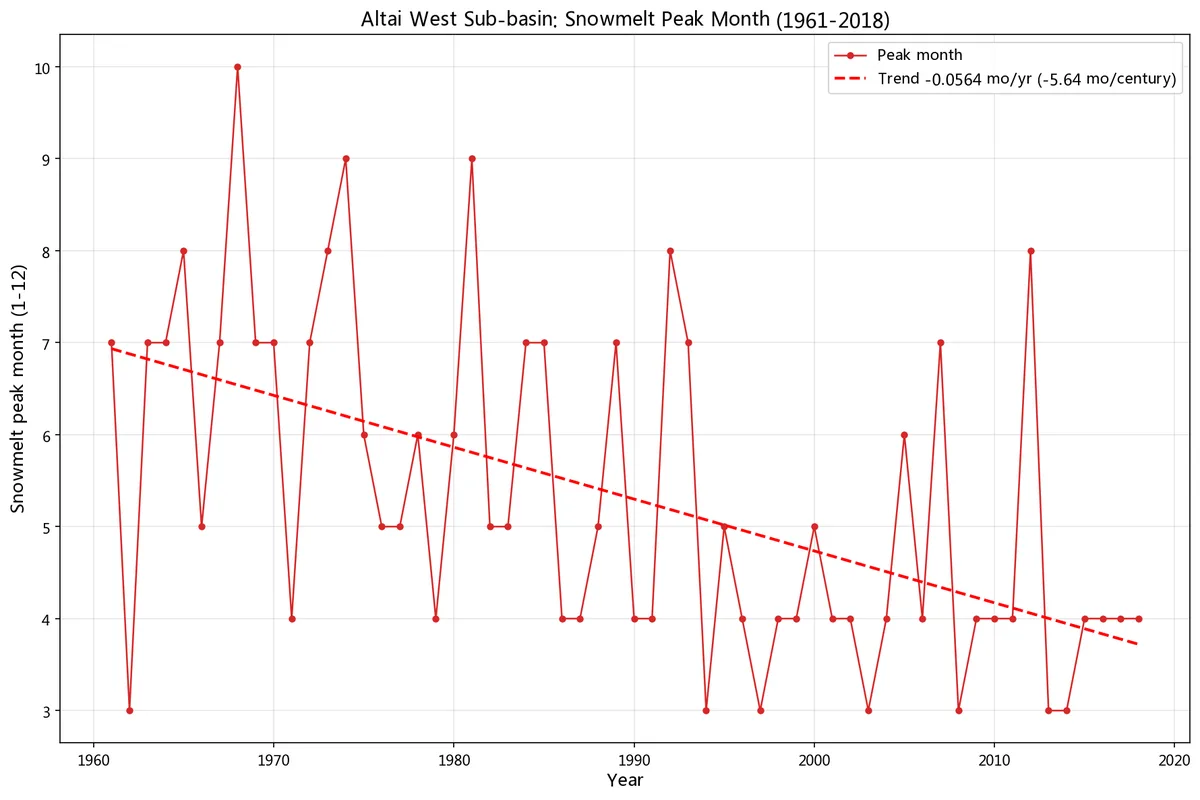
- Snow depth trend & snowmelt peak variation
- System state transition risk assessment
- Time-series visualization figures
- English/Chinese bilingual report support
Batch rapid screening for up to 10 mountain watersheds.
- SRF & SEI unified calculation for all watersheds
- Anchor type batch classification
- Warming sensitivity ranking
- High-risk watershed identification
- Integrated batch summary report
- Maximum 10 watersheds per batch order
Request a Custom Offer
Log In to Request a Custom Offer
Create a free account or log in to request a personalised offer from this Zinner.
Log In / RegisterAsk a Pre-Sale Question
Log In to Ask a Question
To reduce platform spam, pre-sale messages can only be sent by logged-in users.
Create a free account or log in to message this Zinner directly.
Log In / RegisterAt a Glance
Key details about this service to help you decide. Generated by Zinn Hub, not the seller.
Value Position
Method Validation
Analysis Approach
Data Sources
Deliverable Format
What You'll Receive
Full Description
## What I Do
I provide rapid climate-warming response diagnosis for mountain watersheds. Using my self-developed SRF-SEI anchoring framework, I identify watershed sensitivity to warming and detect whether a watershed is approaching a state transition ("anchor switch").
Traditional hydrology answers "where does water come from?" (source partitioning). My framework answers a different question: **How will the seasonal flow structure of this watershed change under warming?**
## What You Get
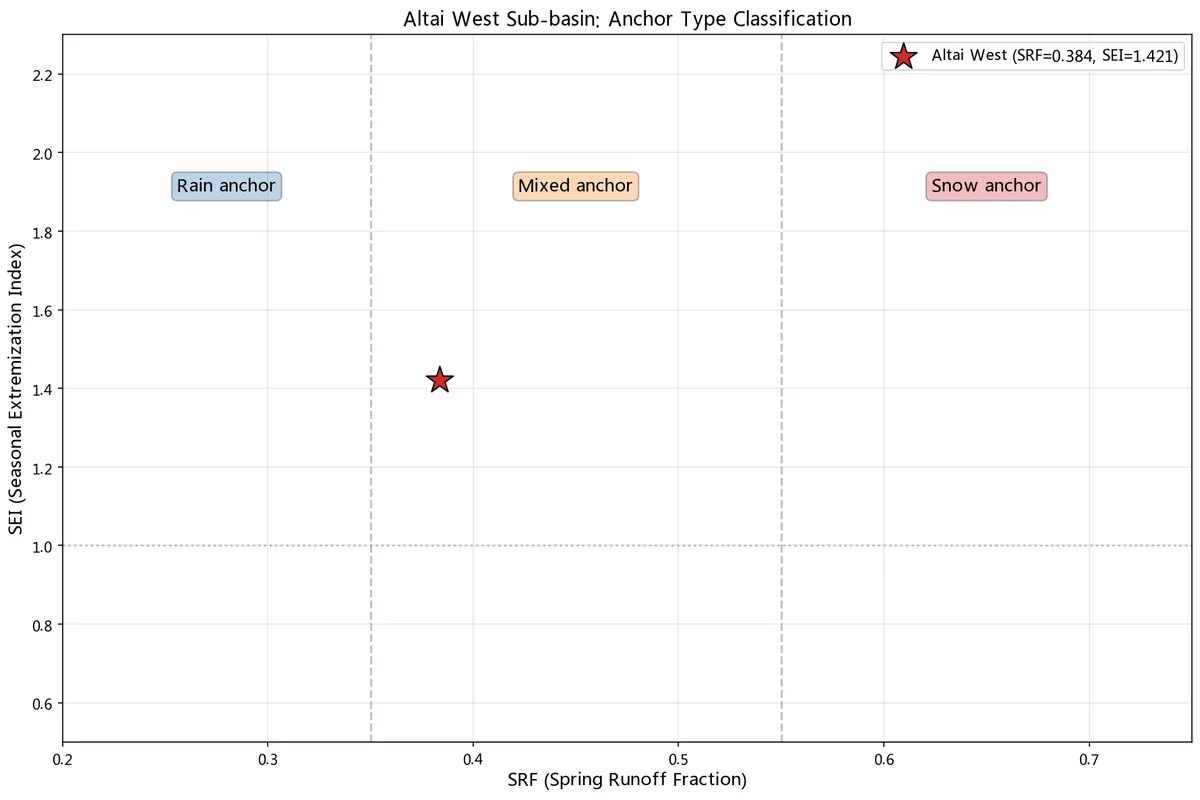
- Watershed anchor type diagnosis (snow anchor / mixed anchor / rain anchor / hidden anchor)
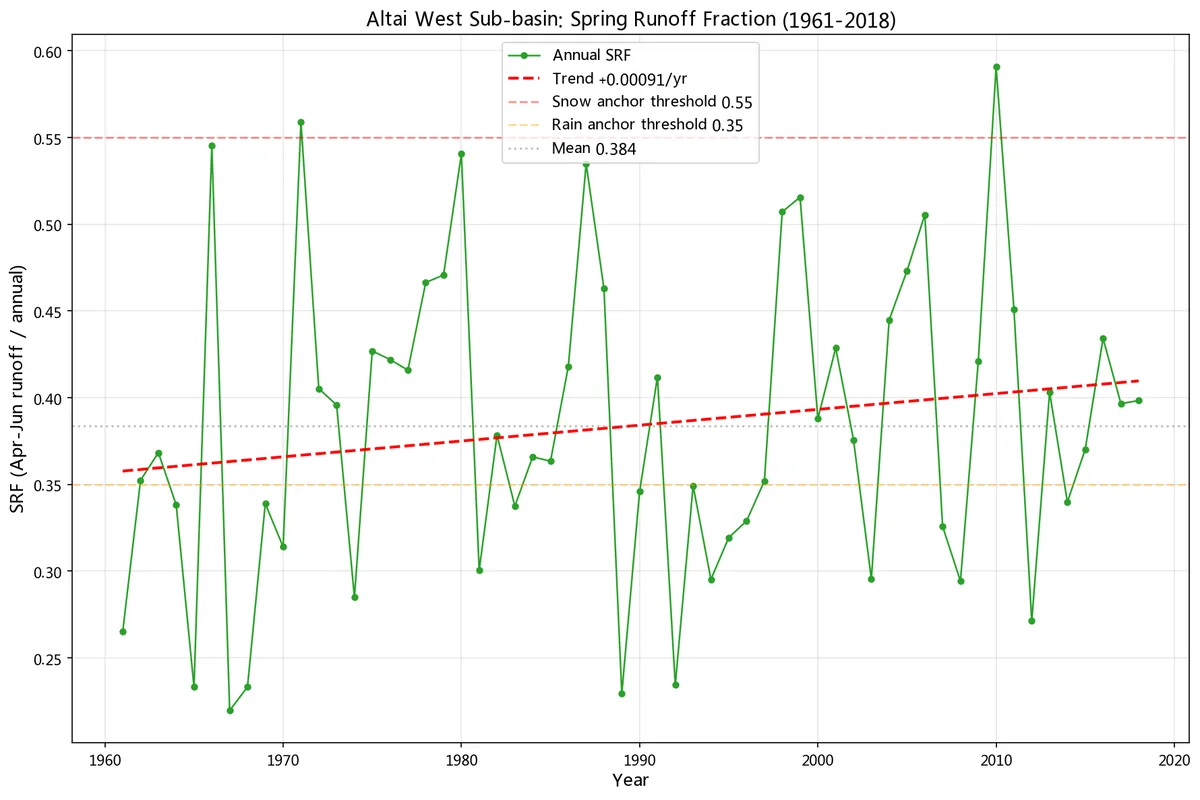
- SRF (Spring Runoff Fraction): fraction of annual runoff occurring during April–June, measuring snow reliance
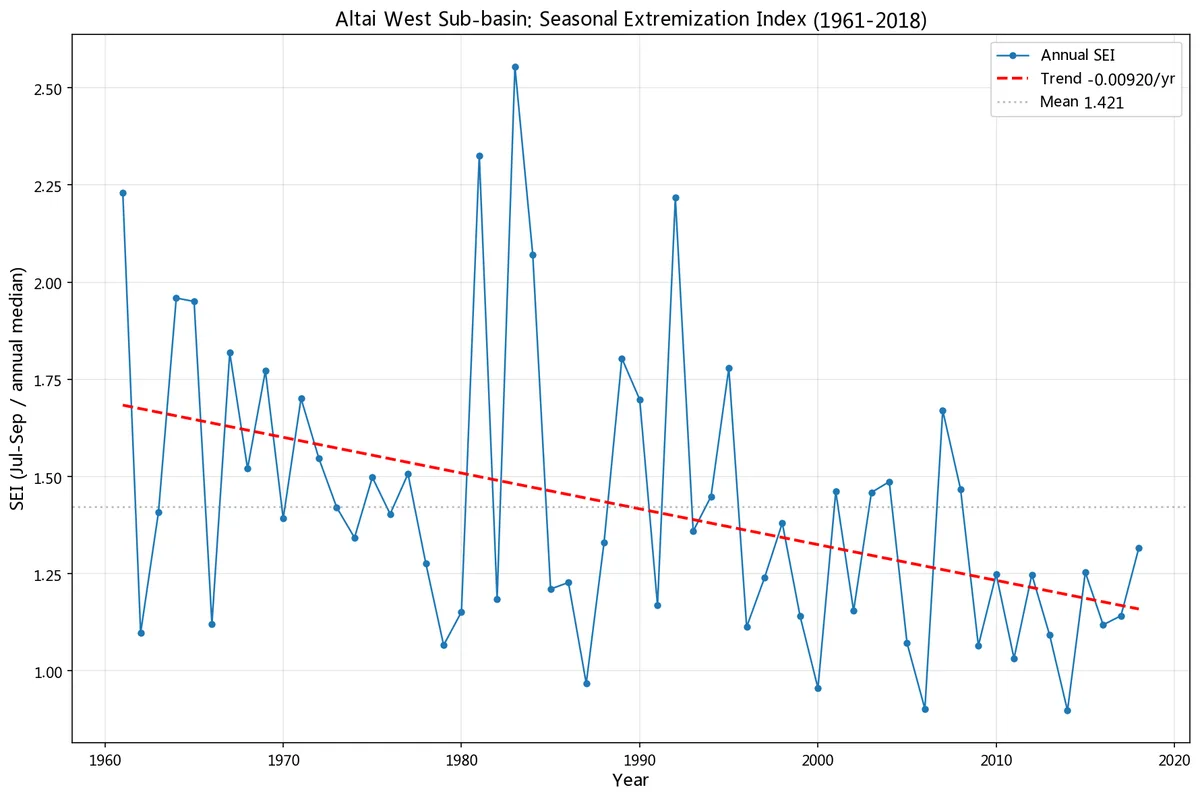
- SEI (Seasonal Extremization Index): July–September mean flow divided by annual median flow
- Historical SEI trend over the past 30–60 years
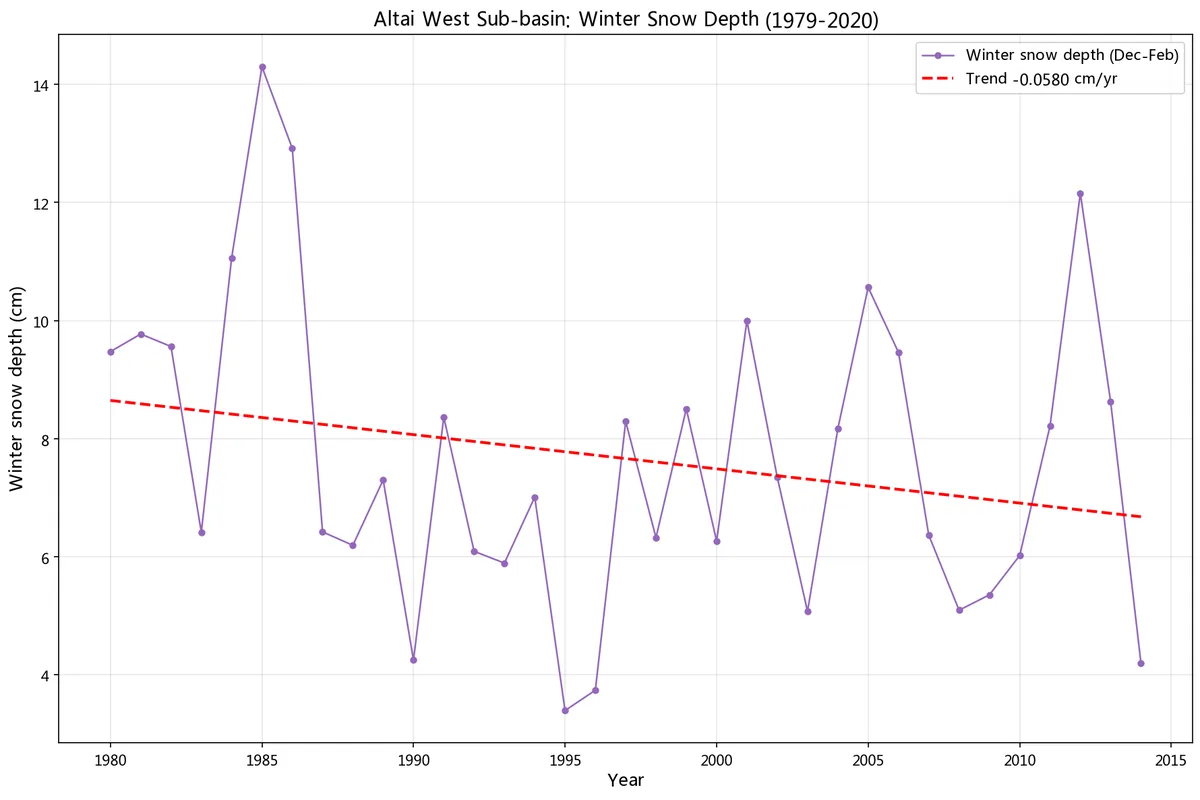
- Historical winter snow depth trend over the past 30–40 years
- Snowmelt peak date trend
- Plain-language conclusion and actionable recommendations
- 5–10 page diagnostic report with time-series figures
## Who This Is For
- Consulting firms: rapid batch screening of watersheds for project pre-assessment
- Planning institutes: regional water security preliminary studies
- Research teams: watershed response pattern analysis
- Water resource agencies: internal research reference
## Two Case Studies
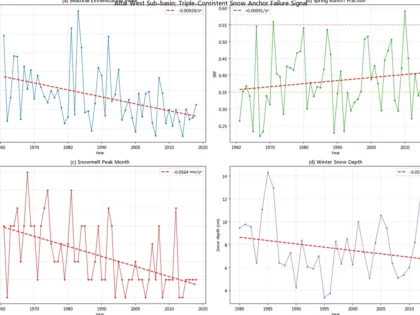
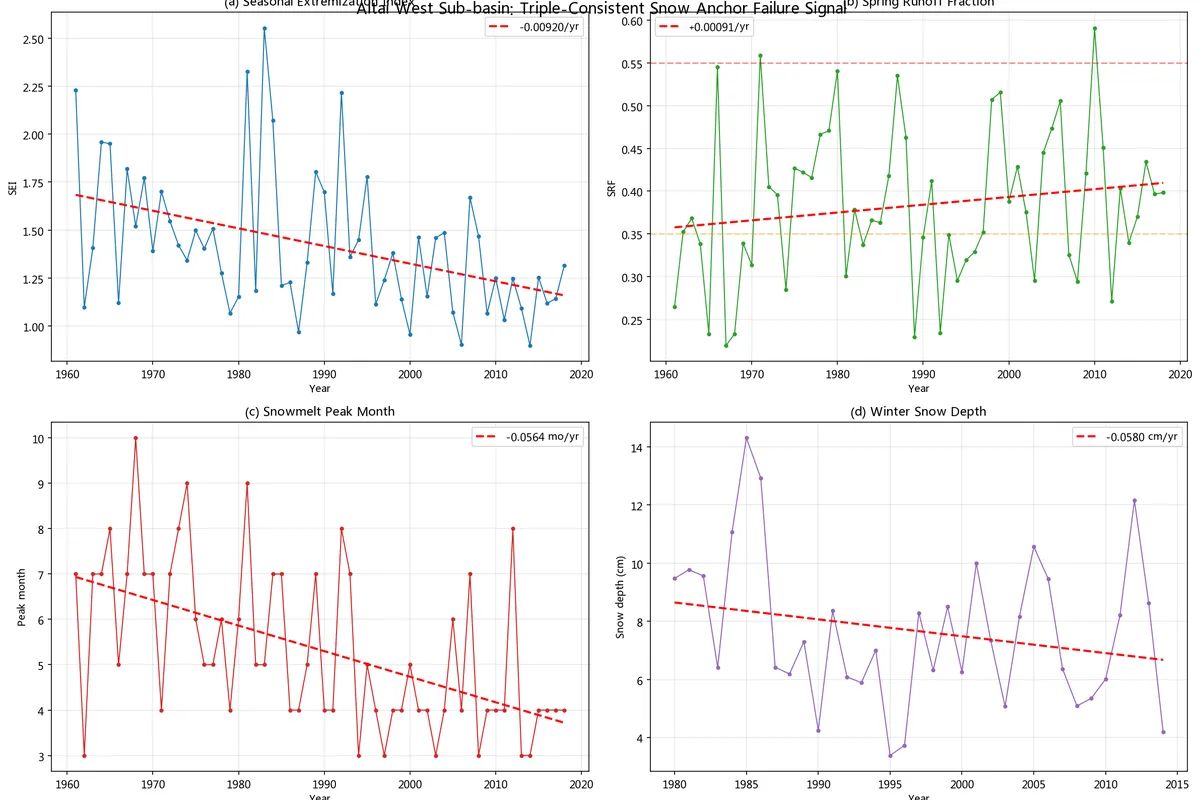
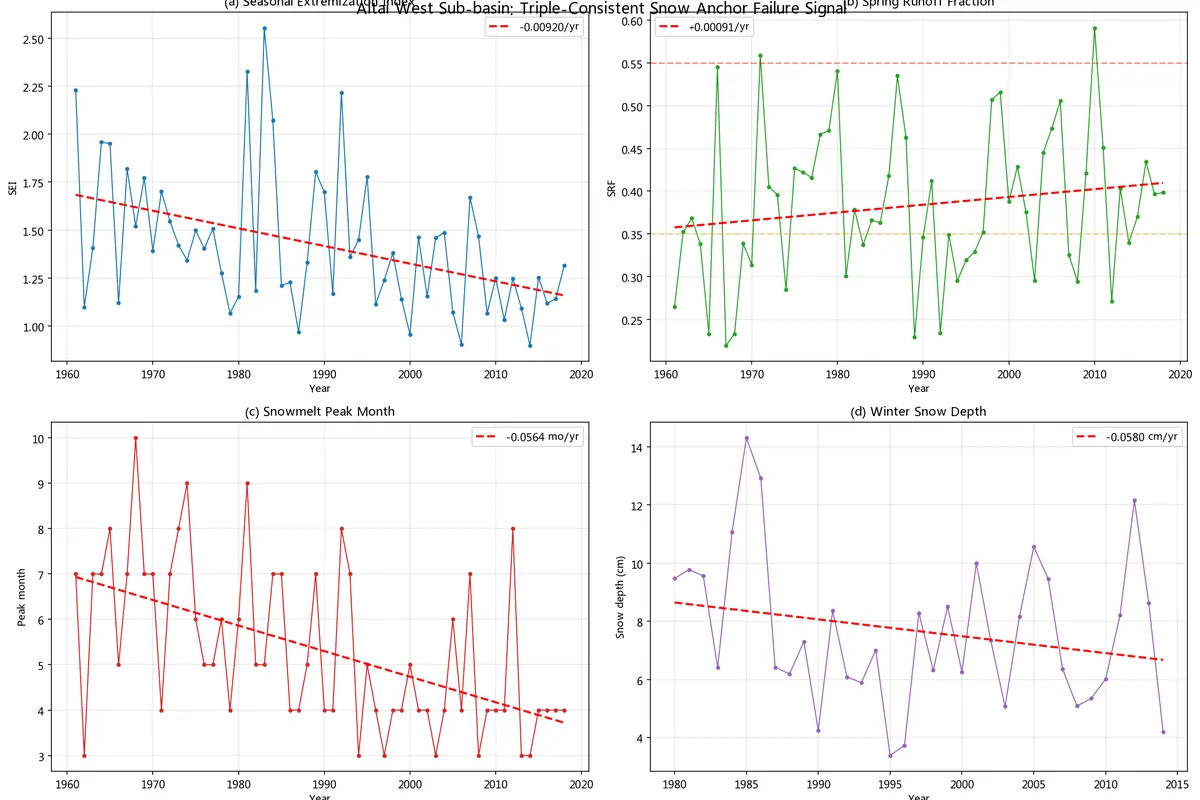
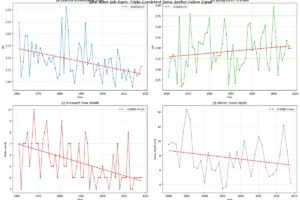
**Altai Mountains Western Sub-basin (high sensitivity)**
- SRF = 0.384
- 58-year SEI change: -37.6%
- Snow depth trend: -0.058 cm/year
- Conclusion: triple-consistent signal, rapidly shifting toward rain anchor
**Hutubi River, Tianshan North Slope (low sensitivity)**
- SRF = 0.377
- 58-year SEI change: -6.5%
- Snow depth trend: +0.009 cm/year (essentially stable)
- Conclusion: weak signal, possibly buffered by glacier melt
These two watersheds have almost identical SRF (0.384 vs 0.377), yet their system sensitivities are completely different. Traditional water source partitioning cannot distinguish them. This framework can.
## Method Source
Ou, Q. (2024). Snow-Dependence Modulates Warming-Induced Seasonal Extremization in Mountain Watersheds. EarthArXiv preprint.
The method has been validated across 78 watersheds in the western United States and 14,406 grid points in Chinese mountains. Out-of-sample prediction is significant (r = -0.405, p = 0.014).
## Workflow
1. You provide watershed coordinates (longitude/latitude range) or a USGS station ID
2. I retrieve streamflow, snow depth, and climate data from public databases
3. I calculate SRF, SEI, snowmelt peak date, and winter snow depth
4. I determine the anchor type and sensitivity level
5. I deliver a PDF diagnostic report
## Turnaround
5 business days.
## Important Note
This service is for academic research reference only. It does not constitute a legally valid hydrological survey or water resource assessment. It is not intended for engineering approval, water resource argumentation, or final insurance pricing. All conclusions should be cross-validated with local in-situ observations.
## Why Choose Me
- I am faster than traditional hydrology: I can screen dozens of watersheds in one week and identify the 10% that need detailed study
- I add a new dimension: not "how much snow water is there", but "how will the system behave under warming"
- I do not compete with traditional hydrology: I do pre-screening, they do detailed modeling. We are upstream and downstream.
Zinner Quality Guarantee
Every Zinner is reviewed and approved before joining the platform.
All services are backed by our quality assurance commitment.
Your payment is protected until you approve the delivered work.
Compare Packages
| 特色 | Single Watershed Quick Diagnosis | Single Watershed Full Diagnosis | Batch Watershed Screening (10+ Watershed |
|---|---|---|---|
| Delivery Time | 3 days | 5 days | 10 days |
| Revisions | 1 | 3 | Unlimited |
| Anchor type diagnosis | ✓ | ✓ | ✓ |
| SRF value | ✓ | ✓ | ✕ |
| Historical SEI trend | ✓ | ✓ | ✕ |
| One-sentence conclusion | ✓ | ✕ | ✕ |
| 2-page PDF report | ✓ | ✕ | ✕ |
| SRF historical trend (30-60 years) | ✕ | ✓ | ✕ |
| SEI historical trend (30-60 years) | ✕ | ✓ | ✕ |
| Winter snow depth trend (30-40 years) | ✕ | ✓ | ✕ |
| Snowmelt peak date trend | ✕ | ✓ | ✕ |
| Four time-series figures | ✕ | ✓ | ✕ |
| 5-10 page PDF report | ✕ | ✓ | ✕ |
| Plain-language conclusion | ✕ | ✓ | ✕ |
| Actionable recommendations | ✕ | ✓ | ✕ |
| Anchor type for each watershed | ✕ | ✕ | ✓ |
| SRF, SEI trend, sensitivity ranking | ✕ | ✕ | ✓ |
| Priority ranking table | ✕ | ✕ | ✓ |
| Full diagnostic reports for top 3 watersheds | ✕ | ✕ | ✓ |
| Excel table + PDF reports | ✕ | ✕ | ✓ |
Samples
View examples of the seller's work related to this Zinn.
Portfolio
Examples of the seller's work related to this Zinn.
SRF-SEI Anchoring Framework for Watershed Climate Response
A self-developed framework for diagnosing mountain watershed sensitivity to climate warming. Validated across 78 watersheds in the western United States and 14,406 grid points in Chinese mountains. Key metrics: - SRF (Spring Runoff Fraction): measures snow reliance - SEI (Seasonal Extremization Index): measures dry-season decline - Anchor type: snow / mixed / rain / hidden Preprint: https://doi.org/10.5281/zenodo.22714393 GitHub: https://github.com/Zsyqdnr
Extra Information
My Workflow
Technical Stack
Service Details
Frequently Asked Questions
Single Watershed Quick Diagnosis: 3 business days.
Single Watershed Full Diagnosis: 5 business days.
Batch Watershed Screening (10+ watersheds): 10 business days.
Rush delivery (2 days faster) is available as an add-on for $30.
You need to provide:
1. Watershed coordinates (longitude/latitude range) or a USGS station ID.
2. Confirmation that the report will be used for internal research reference only.
3. Preferred delivery format (PDF only, or PDF + Excel).
If you don't have coordinates, just tell me the watershed name and approximate location. I will define the boundary and confirm with you before starting.
No. This report is for academic research reference only. It does not constitute a legally valid hydrological survey or water resource assessment. It cannot be used for administrative approval, engineering project initiation, water resource argumentation, or final insurance pricing.
If you need a legally valid report, please consult a licensed hydrological survey institution.
All data comes from public databases:
- CNRD v1.0 Natural Runoff Dataset (National Tibetan Plateau Data Center)
- China Long-Term Snow Depth Dataset
- NASA POWER
- USGS National Water Information System
The data is model-simulated or reanalysis-based gridded data, not in-situ observations. This is appropriate for pre-screening and sensitivity ranking, but should be cross-validated with local observations for final decisions.
If you are not satisfied with the delivered report, please contact me within 7 days. I will revise the report based on your feedback at no extra cost.
If the issue is about data interpretation or methodology, I will explain my reasoning and provide additional context.
Refunds are considered on a case-by-case basis. Since this is a custom data analysis service, refunds are not guaranteed once the report is delivered.
My current data coverage focuses on China (via CNRD and China Snow Depth datasets) and the United States (via USGS NWIS).
For watersheds in other regions, I can use NASA POWER climate data, but I would need to discuss the availability of streamflow and snow depth data first.
Please message me with your watershed location before ordering, and I will confirm whether I can deliver a meaningful diagnosis.
Customer Reviews
See what our customers say about this Zinn