I turn raw data into clear dashboards and actionable insights that help businesses make smarter, faster decisions.
I will analyze your data and build professional dashboards using Excel, Power BI, SQL or Python.
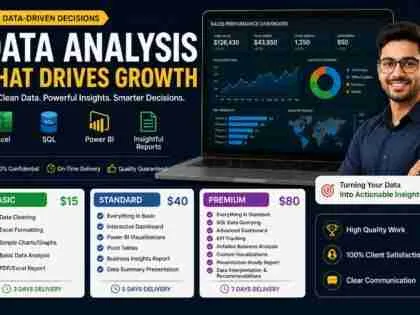
Clean and organize your dataset into a structured, analysis-ready format with simple Excel charts and clear summary insights. Ideal for small datasets that need quick, reliable cleanup.
- Data cleaning & formatting
- Basic charts (Excel)
- 1 dataset
- Summary insights
- 1 revision
- 3-day delivery
Interactive Excel or Power BI dashboard with clear insights and KPI tracking, built from up to 3 datasets. Ideal for turning your data into actionable decisions. Includes 3 revisions.
- Everything in Basic
- Interactive dashboard (Excel / Power BI)
- Up to 3 datasets
- Insight report (clear explanation)
- KPI tracking setup
- 3 revisions
- 3–4 day delivery
Advanced Power BI dashboard with automation, plus SQL/Python analysis, forecasting, and strategic recommendations. Includes 5 revisions and priority 3-day delivery.
- Everything in Basic
- Interactive dashboard (Excel / Power BI)
- Up to 3 datasets
- Insight report (clear explanation)
- KPI tracking setup
- 2 revisions
- 3–day delivery
- Everything in Standard
- Advanced dashboard (Power BI + automation)
- SQL / Python analysis
- Forecasting & trend modeling
- Business recommendations
- 5 revisions
- Priority 3-day delivery
Ask a Pre-Sale Question
Log In to Ask a Question
To reduce platform spam, pre-sale messages can only be sent by logged-in users.
Create a free account or log in to message this Zinner directly.
Log In / RegisterAt a Glance
Key details about this service to help you decide. Generated by Zinn Hub, not the seller.
Value Position
Tools & Stack
Output Types
Dataset Capacity
Best For
What You'll Receive
Full Description
Most businesses today are sitting on valuable data, but very few are actually leveraging it in a way that drives meaningful growth. The issue isn’t the lack of data, it’s the lack of clarity and direction. Raw spreadsheets, scattered reports, and unstructured datasets don’t lead to better decisions. What truly matters are the insights hidden within that data and how they are applied.
That’s exactly where Mercydoo comes in.
Mercydoo delivers professional data analytics services designed to transform your raw data into structured, visually compelling dashboards, concise reports, and actionable insights. The goal isn’t just to analyze numbers, but to help you understand what those numbers mean for your business—and more importantly, what steps to take next to improve performance, increase revenue, and make confident, data-driven decisions.
Whether you’re a startup founder trying to understand early traction, a business owner optimizing operations, or a team managing large and complex datasets, Mercydoo provides tailored analytics solutions aligned with your specific objectives. Every project is approached with a focus on clarity, usability, and measurable impact.
Using industry-standard tools such as Excel, Power BI, SQL, and Python, Mercydoo ensures that your data is not only cleaned and structured but also translated into insights that are easy to interpret and act upon. The emphasis is always on simplicity and effectiveness no unnecessary clutter, just clean visuals and clear direction.
Why work with Mercydoo?
You get professionally designed dashboards that are clean, intuitive, and presentation-ready. The focus remains on business insights rather than just visualizations. Expect fast turnaround times without compromising on quality, along with clear and consistent communication throughout the project lifecycle. Solutions are also scalable, meaning they can grow with your business—from simple datasets to advanced analytical systems.
What’s included in every project:
Every engagement covers data cleaning and preprocessing, structured analysis based on your goals, and the creation of visual dashboards using Excel or Power BI. You’ll also receive a clear, non-technical summary of insights, along with final deliverables that are organized, professional, and ready for reporting or presentations.
Bonus benefits:
You’ll receive a free dataset review before the project begins, two revision rounds on the analysis output, dashboard formatting optimized for presentations, and seven days of post-delivery support to ensure everything runs smoothly.
Services offered include:
Business data analysis across sales, marketing, and finance, dashboard creation, KPI tracking, performance reporting, data cleaning, trend analysis, forecasting, SQL-based data extraction, and advanced Python-driven analytics.
With Mercydoo, your data stops being confusing—and starts becoming a powerful tool for growth.
Zinner Quality Guarantee
Every Zinner is reviewed and approved before joining the platform.
All services are backed by our quality assurance commitment.
Your payment is protected until you approve the delivered work.
Compare Packages
| Feature | Basic-Data Cleanup | Standard - Dashboard & Insights | Premium-Advanced Analytics Solution |
|---|---|---|---|
| Delivery Time | 3 days | 3 days | 2 days |
| Revisions | 1 | 3 | 5 |
| Data cleaning & formatting | ✓ | ✕ | ✕ |
| Basic charts (Excel) | ✓ | ✕ | ✕ |
| 1 dataset | ✓ | ✕ | ✕ |
| Summary insights | ✓ | ✕ | ✕ |
| 1 revision | ✓ | ✕ | ✕ |
| 3-day delivery | ✓ | ✕ | ✕ |
| Everything in Basic | ✕ | ✓ | ✓ |
| Interactive dashboard (Excel / Power BI) | ✕ | ✓ | ✓ |
| Up to 3 datasets | ✕ | ✓ | ✓ |
| Insight report (clear explanation) | ✕ | ✓ | ✓ |
| KPI tracking setup | ✕ | ✓ | ✓ |
| 2 revisions | ✕ | ✓ | ✓ |
| 3–4 day delivery | ✕ | ✓ | ✓ |
| Everything in Standard | ✕ | ✕ | ✓ |
| Advanced dashboard (Power BI + automation) | ✕ | ✕ | ✓ |
| SQL / Python analysis | ✕ | ✕ | ✓ |
| Forecasting & trend modeling | ✕ | ✕ | ✓ |
| Business recommendations | ✕ | ✕ | ✓ |
| 5 revisions | ✕ | ✕ | ✓ |
| Priority 3-day delivery | ✕ | ✕ | ✓ |
Extra Information
MY PROCESS
TOOLS I USE
USE CASES
WHO THIS SERVICE IS FOR:
Service Details
Frequently Asked Questions
Yes, using SQL and Python for scalability.
Yes, all insights are explained in simple terms.
Yes, fully customized based on your needs.
Yes, I can optimize or redesign existing reports.
Excel, Power BI (.pbix), PDF reports, and CSV files.
I accept most common formats including CSV, Excel (XLS/XLSX), Google Sheets, and database exports (SQL, JSON). API connections can also be supported depending on the project scope please message me first to confirm.
As a general guideline:
Basic projects: up to ~50,000 rows
Standard projects: up to ~250,000 rows
Advanced/custom projects: 1M+ rows (depending on complexity)
For very large datasets, I may use specialized tools or suggest a custom solution.
Customer Reviews
See what our customers say about this Zinn
Categories
Zinner Policies
Related Zinns