Table of Contents
Since many marketers and freelancers are still adjusting to the shift from Universal Analytics to Google Analytics 4 (GA4), this guide will help ease that transition. GA4 introduces a different structure, new terminology, and more powerful insights – but it can feel overwhelming at first.
This guide is written specifically for mid-level marketers, freelancers, and digital professionals who are comfortable with Google Analytics basics but want to take their skills to the next level. If you’re ready to shift from simply reading metrics to interpreting them like a chief marketing officer, this guide was made with you in mind.
Too often, marketers open Google Analytics 4 and immediately get lost in charts, metrics, and confusing terms. But a CMO approaches the data differently.
They’re not interested in pretty graphs. They want patterns, insights, and anything that can help drive real business decisions. They care about what the numbers mean – and how those insights turn into actions.
In this guide, you’ll learn how to use GA4 to uncover what really matters. You don’t need to be a data scientist. Just be curious and willing to think strategically.

📈 The Metrics That Matter (Not the Ones Everyone Looks At)
It’s easy to get distracted by shiny numbers – pageviews, bounce rates, user counts. But smart digital marketers (and CMOs) know that not every metric tells the full story. What really matters is how these numbers tie back to your goals
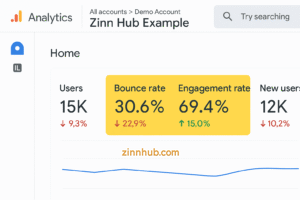
✅ Engagement Rate over Bounce Rate
One of the biggest changes in GA4 is how user activity is measured. Instead of focusing on bounce rate, GA4 uses engagement rate – a more useful metric.
An engaged session is one that:
- Lasts longer than 10 seconds
- Includes multiple page or screen views
- Triggers at least one conversion event
Engagement rate = (Engaged sessions / Total sessions) x 100
This tells you which content keeps users interested – and which doesn’t.
💰 Revenue Attribution
The Attribution reports in GA4 help you understand which marketing channels play a part in conversions. You can choose between models like data-driven or last-click to see how credit is shared across the journey.
The key question isn’t “What got traffic?” – It’s “What contributed to sales or leads?”
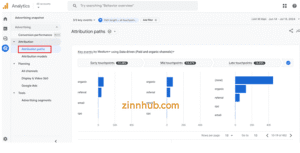
🔄 Conversion Paths
The Attribution Paths report shows the steps users take before converting. It helps you:
- See which channels start or assist conversions
- Understand the full journey, not just the final click
- Avoid undervaluing top-of-funnel content
Use the Path Exploration report in GA4 to identify your site’s most common entry points and trace where users go next – and where they drop off. This visual map helps uncover journey interruptions that may be costing you conversions.
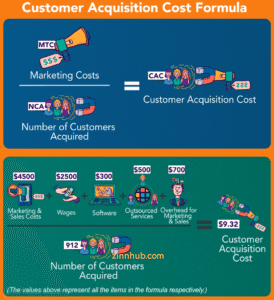
📉 Customer Acquisition Cost (CAC)
GA4 won’t calculate this directly, but if you combine your analytics with your ad and CRM data, you can work it out:
CAC = Total Marketing & Sales Expenses ÷ Number of New Customers Acquired
Tracking this gives you a clearer picture of whether your marketing is profitable.
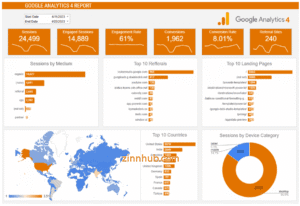
🛠️ Dashboards a CMO Would Actually Use
Rather than drowning in every report, create focused dashboards that surface the data you actually need.
📊 Executive Overview
- Total users
- Revenue
- Conversion rate
- Average engagement time
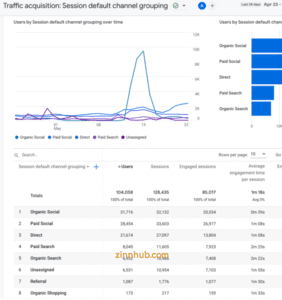
🌐 Channel Performance
Compare how well different traffic sources perform (organic, paid, email, and social).
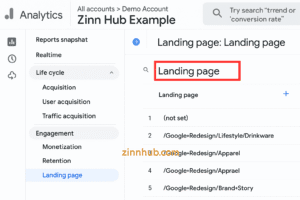
📄 Landing Page Effectiveness
Which pages attract visitors, keep them engaged, and lead to conversions?
🔧 Event Tracking
See which user actions matter most:
- Form completions
- Button clicks
- Scroll depth
🎯 Quick Win: Build a dashboard with just 3–5 key metrics tied to revenue or leads. Strip out anything that doesn’t help you make decisions.
🎯 Making the Data Actionable
🔍 Spot Content Gaps
Low engagement or high exits = content that’s not connecting.
How to do it: Use Reports > Engagement > Landing Page and Reports > Engagement > Engagement Overview to find pages with high drop-off. These might need stronger headlines, better content, or clearer next steps.
💸 Eliminate Waste
Not all traffic is good traffic.
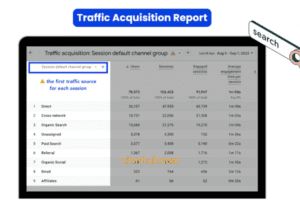
How to do it: Go to Reports > Acquisition > Traffic Acquisition to review channels or campaigns. Look for sources with high cost and low conversion. Adjust or pause them to focus on what’s working.
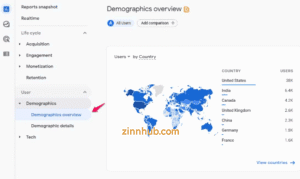
👥 Find Hidden Segments
Sometimes your best audience is hiding in plain sight.
How to do it: In Reports > User > Demographics and Reports > Tech > Tech Overview, spot segments that perform well (e.g. mobile users from a specific country). Use this to tailor messaging or ad targeting.
🧭 Benchmark Against Yourself
Forget industry averages – focus on your own growth.
How to do it: Track your top 3–5 metrics monthly in a spreadsheet or dashboard. Look for patterns over time and aim for realistic improvements.
📈 Action Step: Start with your past year’s data. Set simple improvement goals – for example, “increase form submissions by 10% next quarter.”
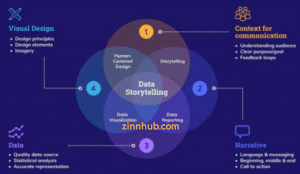
🎙️ Translate Data Into Stories
Data by itself doesn’t persuade people – stories do.
How to do it: Use this simple framework when presenting:
- What happened (e.g. “Engagement dropped on mobile”)
- Why it matters (“Fewer people explored our offerings”)
- What caused it (“Recent mobile redesign likely introduced friction”)
- What’s next (“Revise navigation to highlight key pages”)
🧠 Use one clear visual or chart to back up each point, and keep your language business-focused.
🔗 Integrate GA4 with Your Full Marketing Stack
To get the full picture, connect GA4 with your other tools:
- Google Ads → Track spend and conversions side-by-side
- CRMs like HubSpot or Zoho → Follow the lead all the way to revenue
- Email tools like Mailchimp or Klaviyo → See how campaigns perform beyond the open rate
🧠 Pro Tip: Check Advertising > Attribution > Conversion Paths in GA4. This tells you which channels help along the way, even if they’re not the final touch.
💼 Need Help? Zinn Hub Has Experts Ready
Whether you’re building your first GA4 dashboard or trying to connect analytics with sales, ZinnHub has experienced freelancers who can help.
👉 Browse GA4 Services on ZinnHub
🧠 Turn Insight Into Action
Reading GA4 like a CMO means asking better questions – not just reading more reports.
- What’s really working?
- What’s costing us money?
- What’s the next strategic move?
Start small. Think big. Use your data to drive action.
✅ Start Today: Your 3-Step Action Plan
Ready to transform how you use Google Analytics? Here are three concrete steps to take immediately:
- Create Your Strategic Dashboard
Spend 15 minutes setting up a GA4 view using Explorations (under the Explore tab) or a Custom Report (in the Library). While GA4 doesn’t have traditional dashboards like Universal Analytics, these tools let you focus on just your 3–5 most business-critical metrics. Remove vanity metrics. Pin your view as the default if possible so you start every session with focus. - Map One Complete Conversion Path
Go to Explore > Path Exploration. Choose your highest-value conversion, then trace how users typically reach it. Find the biggest drop-off and plan one small improvement. - Test a New Attribution Model
Go to Admin > Property > Attribution Settings, and switch from Last Click to Data-Driven attribution for one week. Compare results. You might find that previously undervalued channels are doing more than you thought.
📌 Remember: the best CMOs aren’t necessarily analytics experts – they’re strategic thinkers who know which questions to ask about their data. That mindset alone can change how you market, report, and grow.
📚 Glossary of GA4 Terms
Engagement Rate: The percentage of sessions where users interacted with your site for at least 10 seconds, had multiple page views, or triggered a conversion event.
Conversion: A user action that’s valuable to your business, such as filling out a form, completing a purchase, or subscribing to a newsletter.
Path Exploration: A visual report in GA4 that shows how users navigate your site or app, helping you spot common paths or drop-off points.
Attribution Model: The rule or set of rules that determines how credit for conversions is assigned to different touchpoints in the user journey.
Data-Driven Attribution: A GA4 model that uses machine learning to assign conversion credit based on observed user behaviour across sessions and devices.
Traffic Acquisition: A report that shows how users found your site (e.g. organic search, paid ads, referral, direct).
Custom Reports/Explorations: User-created views in GA4 where you can pin key metrics and dimensions for quick, focused access each time you log in.
Event: In GA4, all interactions (clicks, form submissions, scrolls, etc.) are tracked as events, replacing the old category/action/label structure from Universal Analytics.