


Baibhav Ojha
Data Analyst | Python · SQL · Excel · Power BI | Clean data, clear insights
探索他们的链接和此个人资料的其余部分,以了解他们是谁。Zinn Hub 保持每个 Zinner 的个人资料公开透明——因此您可以建立信任并放心地雇用。
由 Zinn Hub 验证的技能
认证 ZinnerBaibhav Ojha已向 Zinn Hub 证明了他们的技能,并提供了他们的工作证据。每位经过验证的 Zinner 都通过了实际操作的质量保证审查 — 因此您可以放心地雇用。
🛡️ 自 October 2026 起已验证
关于
Hi, I'm Baibhav — a Data Analyst from Kathmandu, Nepal, specializing in Python, SQL, Excel, and Power BI.
I help businesses and individuals turn messy, chaotic data into clean datasets, useful queries, and clear visualizations that actually support decisions.
My approach is simple: understand the problem first, clean the data, analyze it, and present findings in a way non-technical people can understand. I don't just run numbers — I try to answer the "so what?" question behind every dataset.
我能为您提供什么帮助:
• Data Cleaning & Preparation — Fix messy Excel and Google Sheets files: duplicates, broken formats, missing values, and inconsistent entries. I make your data usable before analysis even begins.
• SQL Query Writing — Write custom queries to extract, filter, join, and aggregate data from your database. Whether it's SQLite, MySQL, or PostgreSQL, I can get the data you need in the format you need it.
• Power BI Dashboards — Turn raw numbers into clean, interactive dashboards with KPIs, charts, and slicers. Designed so non-technical clients can explore findings without any specialist knowledge.
• Python Data Analysis — Use pandas, NumPy, matplotlib, and seaborn to explore datasets, find patterns, and produce custom visualizations. Great for one-off analyses or automated reports.
Recent work:
I analyzed global healthcare data spanning 200+ countries — designing a relational SQLite database, writing 50+ SQL queries, and producing 7 visualizations to surface key patterns. Key finding: Nepal has roughly 5.7 times fewer hospital beds per person than the world average.
I also combined CO₂ emissions data with disaster records to tell a climate story about Nepal — showing how Nepal emits far less than high-emitting nations but suffers disproportionately.
Before focusing on data analysis, I managed ticketing operations for a 10,000+ attendee event in Kathmandu, achieving full reconciliation — practical experience handling large, time-sensitive datasets under pressure.
Typical turnaround times:
• Data cleaning (up to ~5,000 rows) — 1–2 days
• SQL queries (up to 10 queries) — 1 day
• Power BI dashboard (1–2 pages) — 3–5 days
• Python analysis (EDA, cleaning, or custom charts) — 2–4 days
• Data entry — volume-based; discussed before starting
Revisions: Two free revisions are included on every project, covering adjustments to the agreed deliverable scope. New requirements or expanded scope are treated as separate work and quoted accordingly.
Accepted data sources: CSV, Excel (.xlsx/.xls), Google Sheets exports, SQLite and MySQL database files, and JSON.
Experience: I have been building my Python and SQL skills since early 2026 through self-study, portfolio projects, and hands-on event data management. I'm early in my freelance career, which is reflected in my pricing.
I communicate clearly, ask questions early when a brief is unclear, and aim to respond promptly. Small tasks are welcome — I'd rather earn trust through a well-executed small job than take on large contracts before I've demonstrated what I can do.
If you have a data problem — messy spreadsheets, a report that hasn't been built yet, or data sitting in a database nobody's querying — send me a message. Let's talk about what you need and whether I can help.
技能
此自由职业者专门从事的技术和专业知识。
分类
此自由职业者可用的服务区域。
作品集
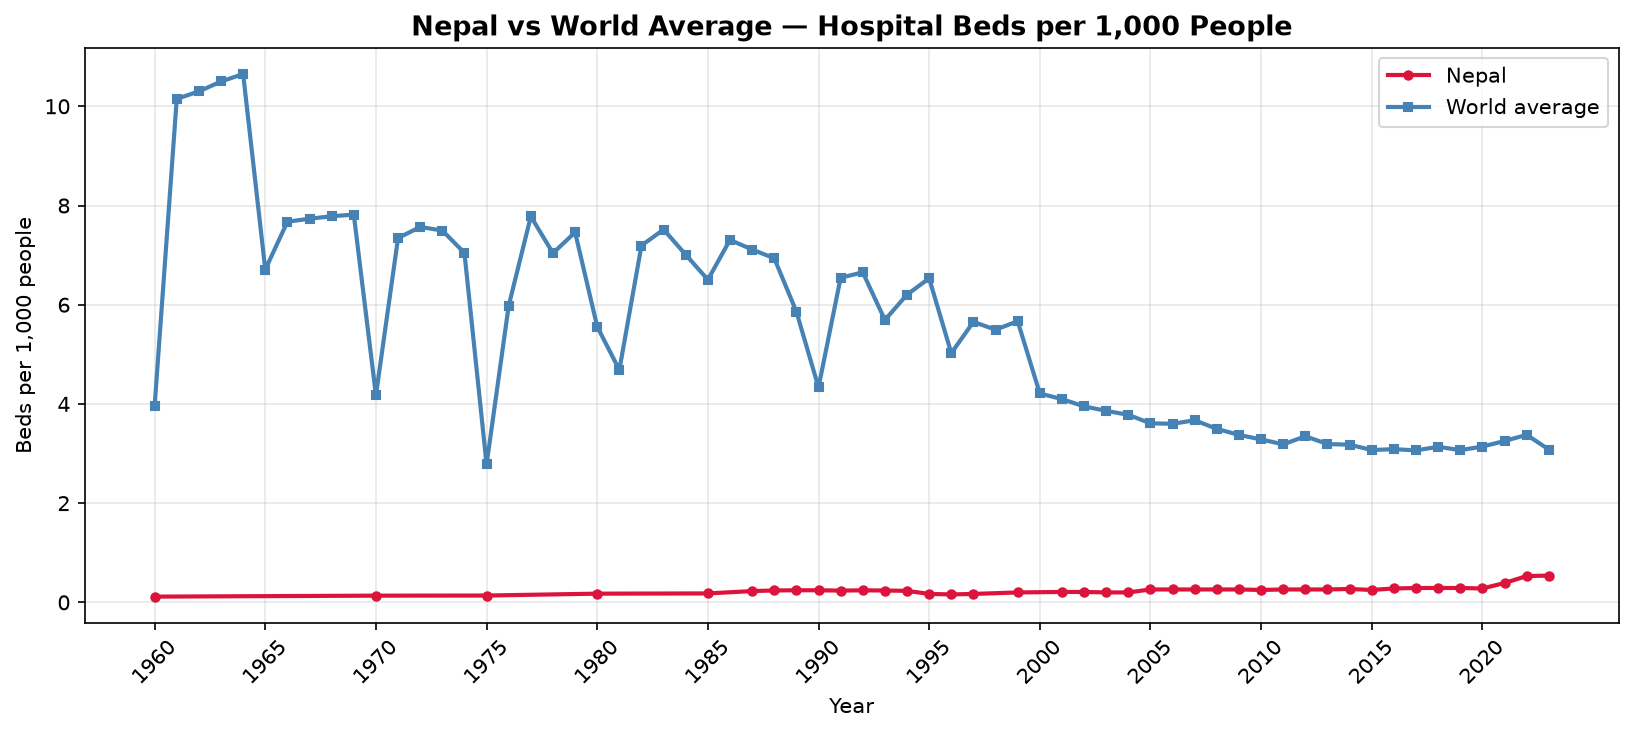
Nepal Health Analysis — Global Dataset (200+ Countries), 50+ SQL Queries
End-to-end data project analyzing healthcare access across 200+ countries. Built a 3-table SQLite database with ~25,000 rows from World Bank data, wrote 50+ analytical SQL queries (joins, aggregations, subqueries), and produced 7 visualizations. Key finding: Nepal has 5.7x fewer hospital beds than the world average.
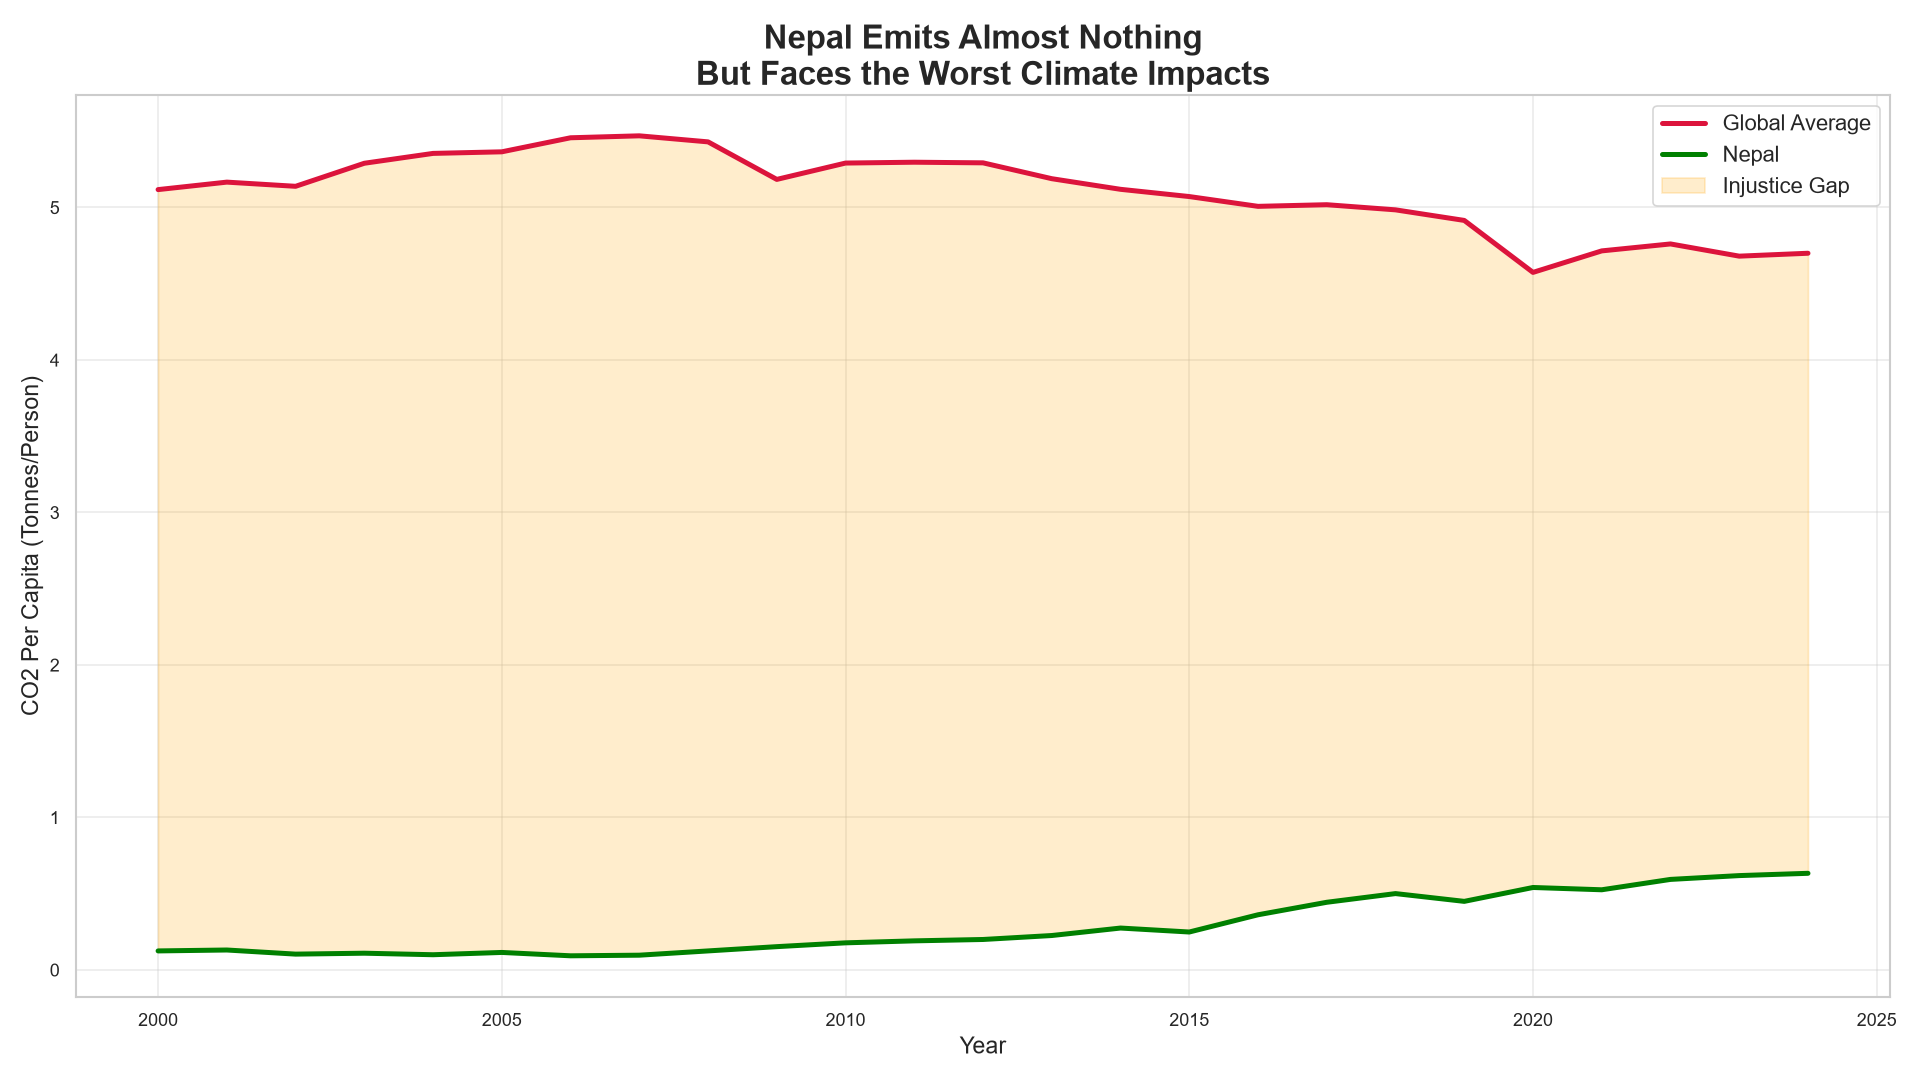
Climate Justice Analysis — Python
Combined CO₂ emissions data with Nepal disaster records to show how Nepal emits 8x less than high-emitting nations but suffers disproportionately from climate disasters. Performed multi-dataset joins, trend analysis, and data storytelling in Python.
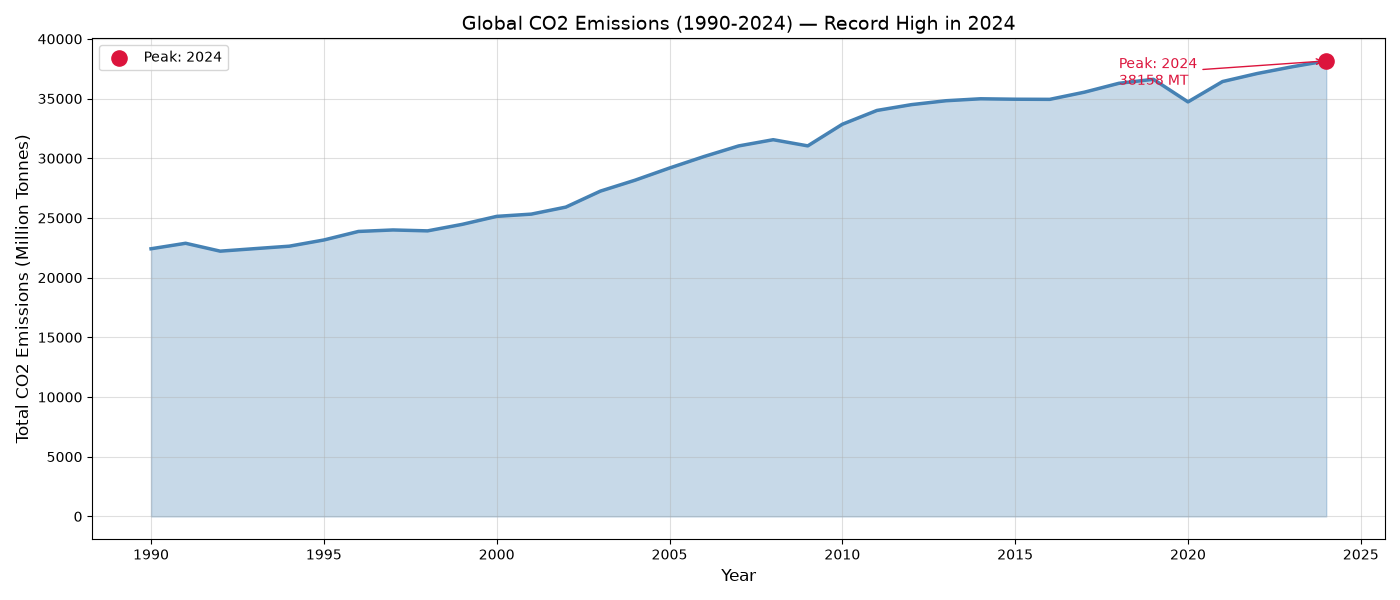
Global CO₂ Analysis — Exploratory Data Analysis
Exploratory analysis of 50,000+ rows of global CO₂ emissions data from Our World in Data. Analyzed top emitters, Nepal's trend, peak year, and CO₂ vs GDP correlation using 10+ chart types in Python (pandas, matplotlib, seaborn).
Runway Career Connect 2026 — Event Data Management (10,000+ Attendees)
Managed ticketing operations and participant data for a 10,000+ attendee education and concert event in Kathmandu. Responsibilities: • Led a team across multiple ticket booths and partner colleges • Built and maintained participant databases with full reconciliation • Handled real-time issues during peak entry hours • Coordinated with registration and organizing committees This was my first hands-on experience managing large, time-sensitive datasets — and it directly led me toward data analytics as a career.
